T1 Radiation Background
T1 Radiation Background. PARTICLE FLUENCE. (R). pl_nr (P1) sensor at small r. P5. 5. P1. 4. 3. 5. 4. 2. 3. (r). 1. 5. 2. 4. 1. 3. mn_fr (P1) sensor at small r. 2. DOSE. 1. P1 (r). P5 (r). P1 (R).

T1 Radiation Background
E N D
Presentation Transcript
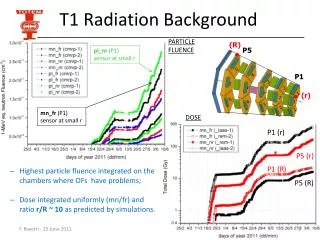
T1 Radiation Background PARTICLE FLUENCE (R) pl_nr (P1) sensor at small r P5 5 P1 4 3 5 4 2 3 (r) 1 5 2 4 1 3 mn_fr (P1) sensor at small r 2 DOSE 1 P1 (r) P5 (r) P1 (R) • Highest particle fluence integrated on the chambers where OFs have problems; • Dose integrated uniformly (mn/fr) and ratio r/R ~ 10 as predicted by simulations. P5 (R)
T1 Radiation Environment Mika’s data 80 T1 • Assuming: • 107s/year • L=1032cm-2s-1 25 750 950 • T1 CSCs are placed between 7.5m and 9.5m • Anode worst position R = 25 cm 107*10-3*102/102 = 10krad/year • Cathode position R = 63÷80 cm 107*10-4*102/102 = 1krad/year