Download

1 / 39
460 likes | 820 Views
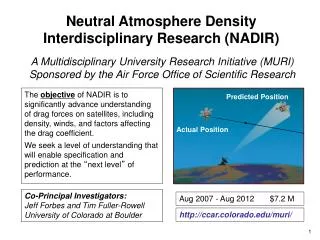
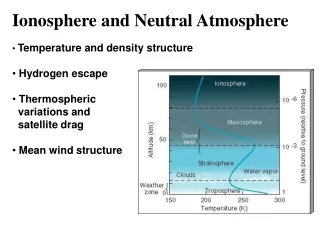
Ionosphere and Neutral Atmosphere Temperature and density structure Hydrogen escape Thermospheric variations and satellite drag Mean wind structure. Tropo (Greek: tropos); “change” Lots of weather Strato (Latin: stratum); Layered Meso (Greek: messos); Middle Thermo

E N D
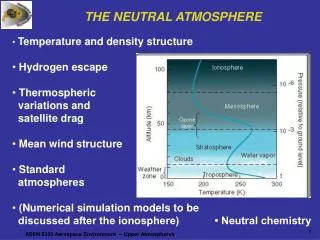
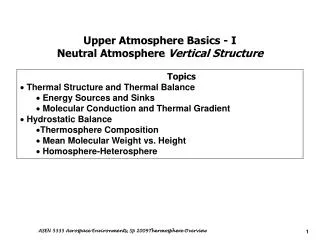
Ionosphere and Neutral Atmosphere • Temperature and density structure • Hydrogen escape • Thermospheric • variations and • satellite drag • Mean wind structure
Tropo (Greek: tropos); “change” Lots of weather Strato (Latin: stratum); Layered Meso (Greek: messos); Middle Thermo (Greek: thermes); Heat Exo (greek: exo); outside
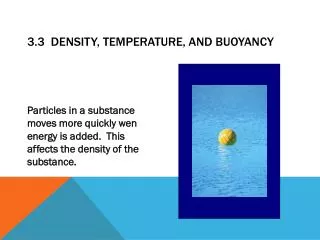
Variation of the density in an atmosphere with constant temperature (750 K).
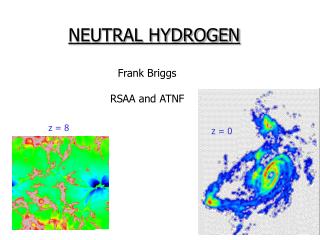
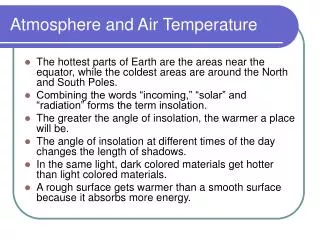
The radiation from the Sun at short wave lengths causes photo ionization of the atmosphere resulting in a partially ionized region called the ionosphere. • Guglielmo Marconi’s demonstration of long distance radio communication in 1901 started studies of the ionosphere. • Arthur Kennelly and Oliver Heaviside independently in 1902 postulated an ionized atmosphere to account for radio transmissions. (Kennelly-Heavyside layer is now called the E-layer). • Larmor (1924) developed a theory of reflection of radio waves from an ionized region. • Breit and Tuve in 1926 developed a method for probing the ionosphere by measuring the round-trip for reflected radio waves.
The ionosphere vertical density pattern shows a strong diurnal variation and a solar cycle variation. • Identification of ionospheric layers is related to inflection points in the vertical density profile.
Diurnal and solar cycle variation in the ionospheric density profile. In general densities are larger during solar maximum than during solar minimum. The D and F1 regions disappear at night. The E and F2 regions become much weaker. The topside ionosphere is basically an extension of the magnetosphere.
Composition of the dayside ionosphere under solar minimum conditions. At low altitudes the major ions are O2+ and NO+ Near the F2 peak it changes to O+ The topside ionosphere becomes H+ dominant. For practical purposes the ionosphere can be thought of as quasi-neutral (the net charge is practically zero in each volume element with enough particles). The ionosphere is formed by ionization of the three main atmospheric constituents N2, O2, and O. The primary ionization mechanism is photoionization by extreme ultraviolet (EUV) and X-ray radiation. In some areas ionization by particle precipitation is also important. The ionization process is followed by a series of chemical reactions Recombination removes free charges and transforms the ions to neutral particles.
At 80-100 km, the time constant for mixing is more efficient than recombination, so mixing due to turbulence and other dynamical processes must be taken into account (i.e., photochemical equilibrium does not hold). Mixing transports O down to lower (denser) levels where recomb- ination proceeds rapidly (the "sink" for O). After the O recombines to produce O2, the O2 is transported upward by turbulent diffusion to be photodissociated once again (the "source" for O). O Concentration
Let the photon flux per unit frequency be The change in the flux due to absorption by the neutral gas in a distance ds is where n(z) is the neutral gas concentration, is the frequency dependent photo absorption cross section, and ds is the path length element in the direction of the optical radiation. (Assuming there are no local sources or sinks of ionizing radiation.) (where is the zenith angle of the incoming solar radiation. The altitude dependence of the solar radiation flux becomes where is the incident photon intensity per unit frequency. is called the optical depth. There is usually more than one atmospheric constituent attenuating the photons each of which has its own cross section.
The density (ns) of the neutral upper atmosphere usually obeys a hydrostatic equation where m is the molecular or atomic mass, g is the acceleration due to gravity, z is the altitude and p=nkT is the thermal pressure. If the temperature T is assumed independent of z, this equation has the exponential solution where is the scale height of the gas, and n0 is the density at the reference altitude z0. For this case For multiple species The optical depth increases exponentially with decreasing altitude. In the thermosphere solar radiation is absorbed mainly via ionization processes. Let us assume that Each absorbed photon creates a new electron-ion pair therefore the electron production is where Si is the total electron production rate (particles cm-3s-1).
Substituting for n and gives The altitude of maximum ionization can be obtained by looking for extremes in this equation by calculating This gives Choose z0as the altitude of maximum ionization for perpendicular solar radiation Thisgives where This is the Chapman ionization function. The maximum rate of ionization is given by If we further assume that the main loss process is ion-electron recombination with a coefficient and assume that the recombination rate is Finally if we assume local equilibrium between production and loss we get
The vertical profile in a simple Chapman layer is The E and F1 regions are essentially Chapman layers while additional production, transport and loss processes are necessary to understand the D and F2 regions.
The D Region • The most complex and least understood layer in the ionosphere. • The primary source of ionization in the D region is ionization by solar X-rays and Lyman- ionization of the NO molecule. • Precipitating magnetospheric electrons may also be important. • The primary positive ions are O2+ and NO+ • The most common negative ion is NO3- • The E Region • Essentially a Chapman layer formed by EUV ionization. • The main ions are O2+ and NO+ • Although nitrogen (N2) molecules are the most common in the atmosphere N2+ is not common because it is unstable to charge exchange. For example • Oxygen ions are removed by the following reactions
The F1 Region • Essentially a Chapman layer. • The ionizing radiation is EUV at <91nm. • It is basically absorbed in this region and does not penetrate into the E region. • The principal initial ion is O+. • O+ recombines in a two step process. • First atom ion interchange takes place • This is followed by dissociative recombination of O2+ and NO+
The F2 Region • The major ion is O+. • This region cannot be a Chapman layer since the atmosphere above the F1 region optically thin to most ionizing radiation. • This region is formed by an interplay between ion sources, sinks and ambipolar diffusion. • The dominant ionization source is photoionization of atomic oxygen • The oxygen ions are lost by a two step process • First atom-ion interchange • Dissociative recombination • The peak forms because the loss rate falls off more rapidly than the production rate. • The density falls off at higher altitudes because of diffusion- no longer in local photochemical equilibrium.
n>0 Refracted rays n=0 n<0 SOUNDER Echo Reflected ray Refracted rays Radio Sounding Principles • Waves in a plasma experience reflection and refraction • Radio waves are reflected at wave cutoffs (n = 0) • Echoes are received if the gradient at the reflection point is normal to the incident signals. • The echo frequency gives the plasma conditions of the reflection point, and the time delay gives the distance of reflection point. • From a series of sounding frequencies, a density profile can be obtained
Specular Reflection and Scatter Ionosonde Field of View and ISR Radar Pencil Beam Radio Sounding: specular reflection wide beam Scatter Radar: Scatter, pencil beam Ionosonde
Modern Ionosonde and Transmit Antenna Digisonde DPS Transmit antenna
Electron density profile Quiet Daytime Mid Latitude Ionogram
The Digisonde Profilogram Cachimbo 16 October 2002 midnight noon
Ionospheric Drift Measurements • Fourier analysis for Doppler spectra • Interferometry with spaced receive antennas
The dense regions of the ionosphere (the D, E and F regions) contain concentrations of free electrons and ions. These mobile charges make the ionosphere highly conducting. • Electrical currents can be generated in the ionosphere. • The ionosphere is collisional. Assume that it has an electric field but for now no magnetic field. The ion and electron equations of motion will be where is the ion neutral collision frequency and is the electron neutral collision frequency. • For this simple case the current will be related to electric field by where is a scalar conductivity. • If there is a magnetic field there are magnetic field terms in the momentum equation. In a coordinate system with along the z-axis the conductivity becomes a tensor.
Specific conductivity – along the magnetic field • Pedersen conductivity – in the direction of the applied electric field • Hall conductivity – in the direction perpendicular to the applied field where and are the total electron and ion momentum transfer collision frequencies and and are the electron and ion gyrofrequencies. • The Hall conductivity is important only in the D and E regions. • The specific conductivity is very important for magnetosphere and ionosphere physics. If all field lines would be equipotentials. • The total current density in the ionosphere is
Within the high latitude magnetosphere (auroral zone and polar cap) plasmas undergo a circulation cycle. • At the highest latitudes the geomagnetic field lines are “open” in that only one end is connected to the Earth. • Ionospheric plasma expands freely in the flux tube as if the outer boundary condition was zero pressure. • For H+ and He+ plasma enters the flux tube at a rate limited by the source. • The net result is a flux of low density supersonic cold light ions into the lobes. • The surprising part is that comparable O+ fluxes also are observed.
Vertical distribution of density and temperature for high solar activity (F10.7 = 250) at noon (1) and midnight (2), and for low solar activity (F10.7 = 75) at noon (3) and midnight (4) according to the COSPAR International Reference Atmosphere (CIRA) 1965.
Atmospheric Compositions Compared The atmospheres of Earth, Venus and Mars contain many of the same gases, but in very different absolute and relative abundances. Some values are lower limits only, reflecting the past escape of gas to space and other factors.
Average Temperature Profiles for Earth, Mars & Venus Venus night day Venus Mars Earth
HYDROSTATIC EQUILIBRIUM If ….. n = # molecules per unit volume m = mass of each particle nm dh = total mass contained in a cylinder of air (of unit cross-sectional area) Then, the force due to gravity on the cylindrical mass = g nmdh and the difference in pressure between the lower and upper faces of the cylinder balances the above force in an equilibrium situation: P + dP dP P nmgdh
Assuming the ideal gas law holds, Then the previous expression may be written: where H is called the scale height and
This is the so-called hydrostatic law or barometric law. Integrating, where and z is referred to as the "reduced height" and the subscript zero refers to a reference height at h=0. Similarly, For an isothermal atmosphere, then,