Download
1 / 24
240 likes | 330 Views
Conducting an in-depth analysis of Walgreen's supply chain to improve next-day and 2-day delivery services, focusing on customer expectations, SKU classification, and network optimization.

E N D
Northwestern MSiA Practicum ProjectE-Commerce Hub & Spoke Analysis Shawna Baskin | Sam Hillis | EunheeKo | Joonhyung Lim
TABLE OF CONTENTS 1. Walgreen’s Project Overview 2. E-Commerce Market & Competitor Analysis • Market Study & Benchmarking Study Summary • E-Commerce Study • Competitor Analysis & Supply Chain Trend 3. Key Customer Insights • Customer Satisfaction Summary • Customer Satisfaction Score • Customer Expectation Toward Shipping 4. SKU Classification – Walgreens.com & Drugstore.com • Methodology • Walgreens.com SKU Classification • Drugstore.com SKU Classification 5. Network Optimization • Objective • Methodology • Delivery Analysis
Project Overview How can we improve DC to Customer shipping? Situational assessment/ problem statement: • One key element is the ability to increase next day and 2 day delivery coverage. We can achieve this goal by minimizing sub-optimal routing problems. • Benchmark Study Analysis. • Customer Satisfaction Analysis • Competitor Analysis • A-B-C SKU classification. • DrugStores.com / Beauty.com • Walgreens.com • Network Optimization. Project Logistics: Impact to the Business: Increase the ability to service customers next day and 2nd day will give Walgreens competitiveness in ecommerce industry.
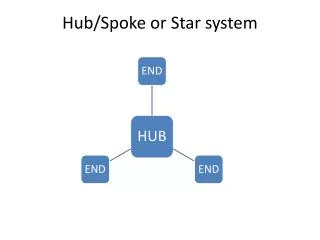
Sub-optimal Routing Problem Sub-optimal Routing Problem IL NJ DC Location NV inefficient delivery time and cost
Online Retail Market Background Every year, more than 100 million Americanspurchase goods from online retail market place. Industry revenue will increase at an average annual rate of 8.8% to total $334.3 billion.
E-Commerce & Consumers Lack of Trust and Delivery Issues Top of Mind For E-Commerce Holdouts. • Low Perceived Security. • Shipping Cost and Delivery Risks • Return Hassles. • Lack of Proper Customer services
Competitors Analysis Industry Defined - Internet Mail Order Retail (Gartner) Walgreens.com Walgreens Beauty.com Drugstore.com
Overall delivery satisfaction remained stable in 2012 Customer Satisfaction Score Walgreens customers felt adequately informed about their order arrival. • Drugstore.com customers reported directionally stronger satisfaction with delivery Were you given advance notification that you would receive only part of your order? Which best describes how you received your order? Source: ForseeCustomer Satisfaction Survey Time Period: Jan 2012- Dec 2012
Customer Expectation Toward Shipping How important is shipping or delivery time to your purchase decision? Very Important Somewhat Important Not Important/Don’t Know On average, what do you think is a reasonable delivery time for a Walgreens.com purchase? How many days did it take you to receive your order? Source: ForseeCustomer Satisfaction Survey Time Period: Oct/Nov/Dec 2012
SKU Classification - Methodology Revenue: A-B-C Since many items are discounted by the manufacturer, we used revenue instead of profit margin for the the classification Demand: 1-2-3 To account for seasonality in the the data (as well as more transient SKUs), we first ran the sub category breakdown classification two different ways. • The network analysis will group A & B SKUs together in the scenario optimization. • Fast moving nature of the CPG business with high turnover. Reference: Kampen, Akkerman, Donk, SKU classification: A literature review and conceptual framework. International Journal of Operations and Production Management. Volume 32, Issue 7, July 2012, pp. 850-87
Walgreens.comSKU Classification by Revenue and Demand A High 3 2 1 B 3 2 1 Revenue 3 2 1 C Low Demand High Low
Demand Density Across US:Southern states have a stronger demand for A3 SKUs than other states. Demand for Class Satisfied within Each State Subclass 1 2 3 A B Class C
Objectives 1. Modeling • Used 15 months of order data • Leverages ABC SKU Analysis • Scalable • Repeatable 2. Hypothesis Testing Would it be both cost effective and improve delivery speeds if we only stocked C SKUs in one DC?
Methodology Tools • Logic Net Plus • Limited to contiguous US Set up • Aggregate customers at the 3 digit zip code level: • Benefit: infinitely scalable • Use package weight as a proxy for order demand • The most relevant contributor to shipping cost is weight • Aggregate all orders as C or Not-C Sku Order • Create blending profiles for each 3-digit zip code • Estimate UPS shipping rates • Proprietary, make an educated guess on corporate discount rates • Set constraints for warehouse storage • Prohibit C SKUs from being stored at all location except 1
Blending Profiles • Aggregate all customers to their 3-digit zip code • Subset orders into those that contain C-Skus and those that do not • Further subset packages by their shipping weight • Now, specify to LogicNet Plus that each customer must have a proportional percentage of their total demand for each package type in shipments of the corresponding weight • This permits abstraction of thousands of products and millions of customers down to a manageable size. All Orders No C Skus C Skus
Delivery Analysis • Storing C SKUs at all will result in at least a 10% improvement in delivery times across all distance bands from DCs. • At each distance band, this new methodology will satisfy a greater % of total customer demand. 10% 14% 10% % improvement at each band 10%