Download

1 / 38
390 likes | 668 Views
3. Natural Climate Variability. Approx. climate range over the 900 years up to 1900. Last century appears unusual. Variations of the Earth’s surface temperature for the past 1,000 years.

E N D
Approx. climaterange over the 900 years up to 1900 Last centuryappearsunusual Variations of the Earth’s surface temperature for the past 1,000 years But the climate variations before the industrial revolutionwere almost certainly natural – what caused them? And could 20th century warming also be a natural variation? SPM 1b
Causes of natural climate variability • ‘External’ forcing of the climate system: • Ice ages are caused by changes in Earth’s orbit (Sun-Earth distance, angle of rotation axis, …) – but these changes occur slowly on long timescales (~10,000-100,000 years) – too slow to explain recent changes • Large volcanic eruptions • Solar variability • ‘Internal’ climate system variability (chaos due to non-linear interactions of a complex system) • El Niño, North Atlantic Oscillation
more reflected SO2 converted to sulphuric acid aerosol layer less absorbed Explosive volcanic eruption adds SO2 to atmosphere Effect of volcanic aerosols Sun Solar radiation Surface cools
Solar forcing of climate Sunspots The energy output of the Sun shows slight fluctuations as the number of sunspots varies
Sunspotsdiscoveredaround1610 byHarriot / Galileo Typically the diameter of the Earth. Slightly cooler regions of the photosphere. Associated with convection in the Sun’s interior. Confusingly, more sunspots correspond to more energy output from the Sun.
Sun-spots show a regular 11-year cycle, but also longer-term cycles
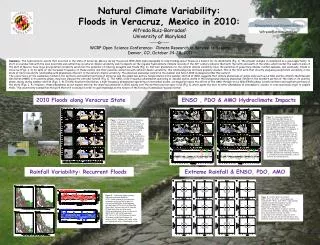
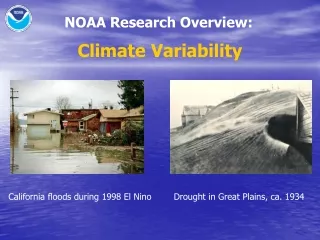
El Niño-Southern Oscillation (ENSO) • ENSO is one of the main causes of global climate variability. But what is El Nino? • Ocean-Atmosphere interaction in the tropical Pacific • Winds, ocean temperatures, cloud and rainfall patterns all change • Occurs every 2-10 years, lasts 12-18 months • Irregular – initiation not understood • During a strong El Nino (e.g. 1997/98), global temperatures can rise, by up to about 0.3 °C • Impacts: Peruvian fishing & seabirds Coral bleaching due to high sea temperatures South American rainfall Global teleconnections – e.g. linked to droughts in Africa Modulates strength of tropical storms
Sea surface temperatureanomalies This is a snapshot of sea surface temperature in the tropical Pacific The anomaly is how it differs from average values.
‘Normal’ vs. El Nino conditions www.pmel.noaa.gov/tao/elnino/
January 1997 A: Cold water off Peru – not El Nino B: Warmer water than usual at 150m depth in W. Pacific
February 1997 C: Warm water spreads across the Pacific beneath the surface
April 1997 D: Warm water reaches surface in the central Pacific – this starts an interaction with the winds: Easterly winds weaken, and this tends to make the ocean warmer: positive feedback
May 1997 Warm water reaches the surface off Peru, and warm water in the central Pacific expands
September 1997 Strong El Nino is underway – sea surface is 2-4°C warmer across half the Pacific
January 1998 El Nino fully underway. Note the cold water at depth spreading from the W. Pacific
March 1998 El Nino has started to shrink – peak temperature anomaly 5°C, compared to 11°C in January
May 1998 El Nino almost over, after about 1 year of elevated sea-surface temperatures. Note the expanding cold anomaly: this heralds La Nina, the opposite phase of El Nino.
Pacific SSTs since 1986 El Nino 1997/8 event was largest of the century
Pacific SST anomalies since 1982 El Nino La Nina The NINO3.4 Index uses SSTs from a particular region of the tropical Pacific
Pacific SST anomalies since 1700 Some indication that 1982/3 and 1997/8 events were unusually large
Current ENSO forecast http://iri.columbia.edu/climate/ENSO/
North Atlantic Oscillation (NAO) • Main expression of climate variability in NW Europe • Reflects strength of westerly winds off the Atlantic NAO + Mild, wetwinter NAO – Cold, dry winter www.met.rdg.ac.uk/cag/NAO/
Winter-time (JFM) NAO index 1950-2010 http://www.cpc.ncep.noaa.gov/products/precip/CWlink/pna/nao_index.html
Variations of the Earth’s surface temperature for the past 1,000 years Most of the past climate variability can be explained byvolcanoes, fluctuations in the sun, and internal variability. Natural variability can’t explain 20th century warming. SPM 1b
Summary 3 (Natural climate variability) • Main short-term natural influences on climate are volcanoes, solar variability, and internal climate system variability • Natural variability can explain fluctuations of about ±0.4 K • Warming in the last century has exceeded the bounds of natural variability – it must have another explanation – the rise of greenhouse gases from human activities is the obvious candidate. • It is possible that human activities may increase climate variability, as well as mean climate