Download

1 / 12
120 likes | 254 Views
Back-up info, some views and experiences (not necessarily shared by all sectors) Applicability and practical aspects of Performance-based allocation. Vianney Schyns, IFIEC Europe Vianney.Schyns@usgbv.com. ECCP Meeting, EU ETS Review, 22 nd May 2007. Number of benchmarks

E N D
Back-up info, some views and experiences(not necessarily shared by all sectors)Applicability and practical aspects of Performance-based allocation Vianney Schyns, IFIEC Europe Vianney.Schyns@usgbv.com ECCP Meeting, EU ETS Review, 22nd May 2007
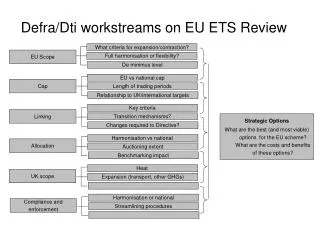
Number of benchmarks Transaction costs & complexity Setting the benchmark below average performance Technical definition all energy carriers Benchmarks in a direct emissions scheme Contents
Pareto: few activities have major coverage Netherlands: almost 100 benchmarks already defined
Transaction costs and complexity • High transaction costs often mentioned in literature Transaction costs lower in practice • Typical consultancy costs: € 25-40,000 per benchmark • Higher cost first time complex benchmark • So 100 benchmarks cost say € 3-4 mln • “Verification Bureau”, NL say < € 1 mln for 100 benchmarks (each 4 years?) • Excl. verifier, for NL only: say € 5 mln for 4 x 75 Mton = < € 0.02/ton CO2 • Determination of benchmarks cheaper on EU scale • Additional: annual costs of monitoring & verification • Complexity often mentioned as problem • Defining new benchmarks needs great care – technology expertise • Practical principle: keep it simple – ignore secondary effects • Once defined rather straightforward
Possible feasible benchmark formula • Benchmark data of plants under the scheme (now EU) Benchmark between average & best performance, e.g. Benchmark = WAE – CF x (WAE – BP) • WAE = Weighted Average Efficiency • CF = Compliance Factor, to comply with total cap • BP = proven Best Practice, proven means actual measured operational data (or rather BP Group, for extra stimulation of innovation) • Formula coincides with EU ETS Directive Annex III (3), average emissions and achievable progress for each activity • Industry most likely opposes following alternatives • Dutch/Flemish worldtop 10% – too short allocation, unstable outcome shape benchmark curve + incomplete participation • Related only to BP (BP + X%) – too short allocation, contra-incentive to improve BP, effectiveness & innovation
Benchmark takes account of all energy carriers (1) CO2 ? • Many energy functions can • be done either with: • Steam, or • Electricity, or • Natural gas or other fuel • Benchmark takes this into account: • Normalised calculation to (total) • primary energy – or total CO2 • Benchmark for only fuel is meaningless • Benchmarks for manufacturing and (related) utility plants Production plant Feeds Product(s) Steam Electricity Natural gas ? Other fuel ? Examples: chemical plants, refineries, paper plants, etc.
Benchmark takes account of all energy carriers (2) • Separation train can be: • Efficient, with net-export • of steam of whole cracker • Inefficient, steam import • Both can be with the • same direct emission of • the cracker itself Simplified scheme steamcracker 2/3 of the investment CO2 Steam recovery Furnaces with heat recovery to steam Separations with high power compressors Feeds Products (ethylene, propylene, etc.) (ethane, LPG, naphta, gas oil, etc.) • Power train can be: • Steam turbine driven • Electric motor driven • Combinations • High influence on • electricity & steam • balance, direct • emissions elsewhere Electricity Steam Methane from feedstock
Benchmarks in a direct emissions scheme (1) Allocation = direct emission – emission {total plant – total BM} CO2 • Example: • Net-import of secondary energy carriers: • 70 – {120 – 100} = 50 • Plant worse than benchmark Production plant Feeds Product(s) • Further examples: • Zero net-import: • 120 – {120 -100} = 100 • Plant worse than benchmark • Net-import: • 70 – {90 – 100} = 80 • Plant better than benchmark Steam Electricity Natural gas Other fuels Site utilities have also benchmarks
Benchmarks in a direct emissions scheme (2) • Easy inclusion in an ETS • No conceptual problem in a direct scheme and no legal problem with Directive, on the contrary • Allowances according to deviation with benchmark • In formula: A = RDE + RSE – Σproduction x (REE/RCE – benchmark) x CCF • RDE = Realised Direct Emission (ton CO2) • RSE = Realised Sequestered Emissions (ton CO2) • REE/RCE = Realised Energy (or CO2) Efficiency (GJ/ton product or ton CO2/ton product) • Benchmark = benchmark energy (or CO2) efficiency • CCF = CO2 Conversion Factor (= 1.0 in case of CO2-benchmark) • Note: Process emission is in this view included in the Best Practice
Benchmarking in the product chain Benchmarking provides incentives in the whole product chain … Electricity Electricity and heat generation Industrial manufacturing plant with use of electricity and heat Fuel Fuel Product Feed Heat, from CHP or from boilers … the efficiency of the production of electricity & heat … the efficiency of the use of (fuel), electricity & heat
Benchmarks need great care Present Dutch formula is incorrect Allowances = HE x G x E x C HE = historic emissions G = Growth Factor E = Energy Efficiency (benchmark/actual energy use) C = Compliance factor to remain within total cap Formula becomes meaningless – even introduces gaming – in case of significant import of secondary energy carriers (utility boilers & CHP are rightfully separate), for example: HE (= ~ zero) x E = ~ zero Hardly or zero CO2 Production plant Feeds Product(s) Steam Electricity Hardly or zero fuel Other effectiveness’ shortcomings Maximisation E (110%) Minimisation E (85%)