Download
1 / 13
130 likes | 220 Views
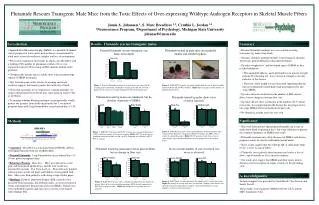
Success of seabeach amaranth ( Amaranthus pumilus Raf.) using habitat selection based on light detection and ranging (LIDAR) data. Jon D. Sellars 1,2 Claudia L. Jolls 1 Cass A. Wigent 1. 1 East Carolina University Department of Biology Greenville, NC. 2National Geodetic Survey

E N D
Success of seabeach amaranth (Amaranthus pumilus Raf.) using habitat selection based on light detection and ranging (LIDAR) data Jon D. Sellars1,2 Claudia L. Jolls1 Cass A. Wigent1 1East Carolina University Department of Biology Greenville, NC 2National Geodetic Survey National Oceanic and Atmospheric Administration
Amaranthus pumilus • fugitive • intolerant of competition • requires disturbance • narrow elevation range on non-eroding beaches (Bücher and Weakley 1990) • habitat is relatively homogenous
LIght Detection And Ranging data (LIDAR) Twin Engine Aircraft Elevation ~700 m 30 Degree Scan Angle Laser Overlapping Swaths Scan Width (~300 m) Scan Direction (parallel to beach)
Discriminant Function Analysis • Variables extracted from 2000 LIDAR were used to model suitable habitat in 2001 for Shackleford Banks and Cape Lookout Spit, Cape Lookout National Seashore, NC • Elevation • Elevation in the North American Vertical Datum of 1988 (m) • Distance from shore • Distance from the mean high water line (m) • Surface complexity • Standard deviation of the surface normal vectors in a 9 x 9 m2 neighborhood • Slope • Slope of the surface in degrees • Grey scale reflectance • Passive LIDAR data able to distinguish sand/water/vegetation
Discriminant Function Analysis • Plant locations were captured with a Differential Global Positioning System (DGPS) • Estimated accuracy ± 1.2 m • Plants (n = 168 represented by 126 unique DGPS locations) were compared to randomly generated points (n = 426) with in the study area • 3 x the number of random points were used to capture the greater background variation • Plant occurrences (n = 26) originally withheld from the model were used as a validation set • Every fifth point that represented a single plant location • All statistical analyses were performed in SPSS 11.5.0 • Variables were square root transformed to keep the DFA robust despite outliers
Discriminant Function Analysis Step 1. We analyzed all five variables to identify the most important as based on correlation to the discriminant function.
Discriminant Function Analysis Step 2. We analyzed just Distance and Passive
Discriminant Function Analysis • Distance and reflectance were best able to distinguish suitable habitat based on their ability to differentiate between Random and Occurrence Points • Variable coefficients from SPSS were used to model habitat in ArcView (3 m2 cells) • Using Map Calculator function • Model correctly identified 24/26 (92 %) of validation points as occurring in suitable habitat • Overlay analysis in ArcView
Probability a cell contains Suitable Habitat 0.50 - 0.75 > 0.75 • Plant Location Area Enlarged
Probability a cell contains Suitable Habitat 0.50 - 0.75 > 0.75 Mean High Water (MHW) MHW + 0.77 m MHW + 2.00 m • Plant Location Area Enlarged
Conclusions • Habitat variables can be extracted from remote sensing data • LIDAR data can be used to delineate and model suitable habitat for Amaranthus pumilus • Distance from shore and passive data efficiently model suitable habitat • Potentially distance from shore is a surrogate measure of disturbance • Passive data delineate areas free of vegetation
Applications of Remote Sensing Data to Rare Plant Conservation • Covers large geographic areas • Identify critical environmental variables and habitat • Can aid rapid assessment of sites for species occurrence / re-introduction
ACKNOWLEDGMENTS North Carolina Plant Conservation Program National Park Service East Carolina University ALACE (NOAA, NASA, USGS) Mike Aslaksen, NGS-NOAA Marj Boyer, NCDA-PCP Jeff Colby, ECU Karl Faser, ECU Cecil Frost, NCDA-PCP Michael Hearne, NOAA Mark Jansen, NOAA Marcia Lyons, NPS Karen Trueblood, ECU Keith Watson, USFWS Jason Woolard, NGS-NOAA