Download
1 / 33
330 likes | 465 Views
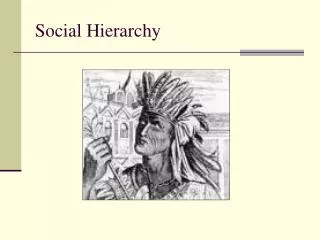
Joseph M. Whitmeyer UNC Charlotte August, 2003. HIERARCHY FROM EXCHANGE. Hierarchy is ubiquitous. Anthropological evidence on human societies (D. Brown) Discussion Groups (Bales) Someone talks most (usually 50%) Big talker deemed to have most influence. Theories of Hierarchy.

E N D
Joseph M. Whitmeyer UNC Charlotte August, 2003 HIERARCHY FROM EXCHANGE
Hierarchy is ubiquitous • Anthropological evidence on human societies (D. Brown) • Discussion Groups (Bales) • Someone talks most (usually 50%) • Big talker deemed to have most influence
Theories of Hierarchy • Exchange of prestige for ... (Homans, Coleman) • Expectation States Theory (Berger, Ridgeway, Webster) • In process of social learning (Henrich and Gil-White) • Reciprocal influence of status and exchange (Eckel, Thye)
My Study • Task-focused group • Achievement (get prize) • Choice (choose between options) • Both (win, but with your candidate) • Only concerns selection of leader • Computer simulation
3 Assumptions • Human behavior: consistent, similar, motivated • Humans value prestige (Veblen) • Leaders provide collective benefit to group
The Simulation Model • Each iteration each member decides whom to support • Support member giving highest payoff for YOU • Know how much support each member had in previous iteration
Payoff components • Perceived ability of member • Amount of support member has • Value of collective benefit • Rivalness of collective benefit • If supporting self, value of prestige
Parameters and variables 1 • Group size n • Collective benefit: B > 0 • Rivalness: 0 λ 1 • Individual share: • S = [(n - n + )/n]B • Net value of prestige • Normally distributed • Usually mean > 0, s.d. = 1/2 mean
Parameters and variables 2 • Ability to deliver B: 0 Ai 1 • Spread of ability perception • 0 U 1 • U = 0: complete agreement about abilities • U = 1: maximal divergence • For choice, spread includes heterogeneity of values
Figure 1. Correlation Between Actual and Perceived Ability as Function of U, for 3 Group Sizes.
Parameters and variables 3 • Production function for leader effectiveness • linear • accelerating • decelerating • S-shaped (logistic) • inverse S-shaped
Equations • Let sj be j’s share of support, Pij be i’s perception of j’s ability • i’s perception of j’s effectiveness: • eij = sja Pij • a = 1: linear • a > 1: accelerating • a < 1: decelerating • S: eij = Pij / (1 + exp[10(.5 - sj)]) • inverse S: eij = {.5 - .1ln([1/sj] - 1)}Pij
Equations (cont.) • Let uij be i’s net benefit from supporting j • Let vi be the net value of prestige for i • uij = eij S for i j • uij = eij S + vi for i = j
Results - Consensus • Consensus is quick or not at all • 1-6 iterations for n = 3 to 10 • More iterations for larger groups • Consensus is stable: no one ever switches from leader • Like discussion groups
Results - By p.f. • To standardize magnitude of results, collective benefits (Bs): • 70 for decelerating • 95 for linear, inverse S-shaped • 395 for S-shaped • 495 for accelerating • U set at 0.2. • Ability spread evenly from .8 to .2.
Group size & rivalness: • For all p.f.s, proportion reaching consensus is lowest with high group size and low rivalness • With n < 6, rivalness 0, all reach consensus • With n > 25, rivalness 1, none reach consensus
Interactions: • Rivalness 0: • For linear, decelerating, inverse S-shaped, increase in group size has NO effect • For accelerating, S-shaped, increase in group size means consensus goes to 0
Interactions (cont.) • For linear, accelerating, and S-shaped: negative effect of rivalness on proportion reaching consensus increases as group size increases. • For decelerating and inverse S: • group size does not affect negative effect of rivalness • group size has little direct effect on proportion reaching consensus.
Implications • Crucial period is when support low • Since • prestige is awarded consensually in large groups • and prestige is awarded automatically, then • prestige is awarded especially for nonrival goods.
Spread of ability perception • U has strong negative effect on proportion of groups that reach consensus on leader • Its effects become stronger as group size increases. • So: to reach consensus, some agreement among group members about relative ability is necessary.
Figure 8. Effect of Spread of Ability Perception (U) and Group Size. Rivalness = 0; Decelerating P. F.
Mean value of prestige • Question: Suppose two populations differ in mean value of prestige. Will leaders tend to come from one? • Answer: No.
Mean val. of prestige (cont.) • Suppose As have higher mean than Bs, s.d.s same (5). Then: • Chances of random A having higher preference for prestige than random B are greater than the chances that an A will be leader. • Difference of 1: .556 vs. < .52 • Difference of 5: .76 vs. < .57
Summary 1. Stability is reached quickly. 2. Full consensus is permanent. 3. Increasing spread of ability perception diminishes proportion of groups reaching consensus. 4. Production function probably decelerating or inverse S-shaped, perhaps linear.
Summary (cont.) 5. Critical period for deciding group leader is initial phases of gathering support. 6. Prestige awarded mostly for nonrival or nearly nonrival benefits. 7. Populations with different mean net values of prestige produce similar numbers of leaders.
Next Steps • Items 1 - 3 parallel experimental findings • Items 4 - 7 are predictions to be tested
On nonrival benefits (#6): • Exs.: Leadership, entertainment, protection or defense, and information of some types. • Suggests theory can be applied to socio-emotional groups too. • Apply to different historical periods, with different non-rival benefits.