Download
1 / 35
350 likes | 433 Views
Heat Island Effect and Air Pollution. Review of last lecture. General circulation models: Grid size. 3 usages. Name of the basic set of equations. 4 components of the climate system model. Mesoscale models: grid size. 3 characteristics. How do human activities change the global climate?.

E N D
Review of last lecture • General circulation models: Grid size. 3 usages. Name of the basic set of equations. • 4 components of the climate system model. • Mesoscale models: grid size. 3 characteristics.
How do human activities change the global climate? Human beings are changing the global climate system in three different ways: • Change land cover (deforestation and afforestation) • Release or cleanse pollutants (aerosols) • Release or cleanse greenhouse gases
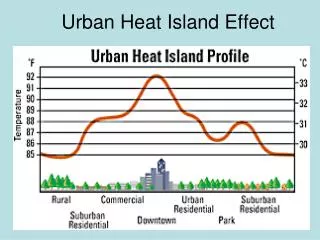
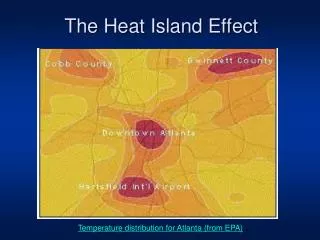
The Heat Island Effect Temperature distribution for Atlanta (from EPA)
Effects of vegetation • Makes water/heat reservoir deeper (transport deep water • out of soil) • Enhances evaporation (leafs increase evaporation area) • Dependent on vegetation type
Vegetation feedbackVegetation in turn is affected by environmental conditions (e.g. seasons, droughts, global warming)
Effects of different surface types Convective instability increases Deeper heat reservoir (smaller T change) Deeper water reservoir (Wetter surface) Enhanced latent heat flux
The heat island effect • Nighttime: City warmer than surrounding rural area • Daytime: City has same air temperature as rural area
Temperature distribution for Atlanta (from EPA)
Causes of the heat island effect “Canyons” between buildings • Increased SW absorption caused by canyon geometry (increased area and multiple reflection) • Decreased LW loss caused by canyon geometry • Increased greenhouse effect caused by air pollution • Anthropogenic heat source • Increased sensible heat storage caused by construction materials • Decreased latent heat flux caused by change of surface type • Decreased sensible and latent heat fluxes caused by canyon geometry (reduction of wind speed)
Mitigation of heat island effect • Greening the city (streets and roof top) • Change construction materials • Reduce anthropogenic heat sources
Video: Science to Protect the Air We Breath (by EPA) • http://www.youtube.com/watch?v=3PO_3exwN-I
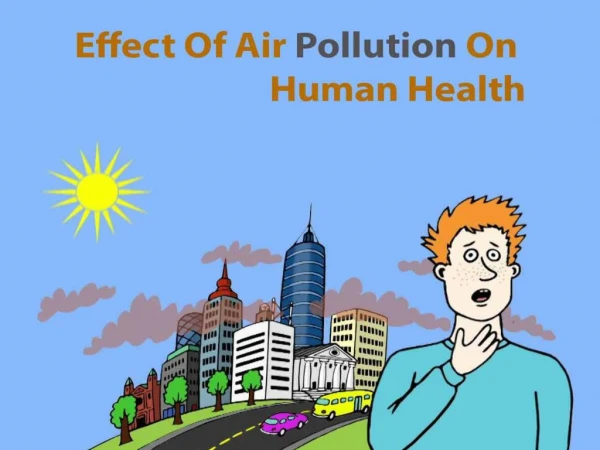
Introduction • Air pollutants are gases, liquids or solids in the air that can adversely affect plant and/or animal life. • Primary pollutants are pollutants that are emitted directly by natural or anthropogenic (manmade) processes. • Secondary pollutants are pollutants that arise from chemical reactions of atmospheric gases with gases emitted by natural or anthropogenic processes. • There are six major pollutants: particulates, carbon oxides, sulfur dioxides, nitrogen oxides, volatile organic compounds, ozone
Major pollutants: (1) Particulates • Particulates (aerosols) are solid or liquid matter suspended in the air (from 0.1 to 100 µm in size). • PM10 (<10 µm) enters lungs (associated with asthma); PM2.5 (<2.5 µm) even more dangerous (lung cancer).
Global distribution of PM2.5 (2001-2006) Image from NASA Credit: Dalhousie University, Aaron van Donkelaar
U.S distribution of PM2.5 (2001-2006) Image from NASA Credit: Dalhousie University, Aaron van Donkelaar
Major pollutants: (2) Carbon monoxide • Carbon monoxide (CO) is a colorless, odorless gas from volcanic eruptions, forest fires and other processes. • Extremely toxic and dangerous to humans and animals.
Major pollutants: (3) Sulfur dioxide • Sulfur compounds can occur as gaseous or aerosol forms. • respiratory irritant. contributes to acid fog and acid rain.
Major pollutants: (4) Nitrogen Oxides (NOX) • Nitric oxide (NO) is a nontoxic, colorless, and odorless gas. • Nitrogen dioxide (NO2) is a toxic, yellow to reddish-brown gas that is pungent and corrosive. Provides polluted air with the yellow to reddish brown color.
Major pollutants: (5) Ozone • Ozone, NO2, formaldehyde and other gases combine with solar radiation to form Los Angeles-type photochemical smog. • causes respiratory and heart problems.
Major pollutants: (6) Volatile Organic Compounds (Hydrocarbons) • are made of carbon and hydrogen. Examples: methane, butane, propane, octane, etc. • Health effects vary
Atmospheric Conditions and Air Pollution (1) Effect of Winds on Horizontal Transport • High concentrations of pollutants in a small area (usually due to anthropogenic sources) are the biggest air pollution problems. • The horizontal and vertical transport of air pollutants by winds help control the local concentrations of pollutants. • Concentrations are inversely related to wind speed.
Atmospheric Conditions and Air Pollution (2) Effect of Atmospheric Stability • There are many turbulent eddies in an unstable boundary layer, but few in a stable boundary layer • Eddies can mix air vertically. Unstable Neutral Stable
Inversions • Inversions are absolutely stable and free of eddies • Inversions can trap pollutants near the Earth’s surface. Low level inversion Upper level inversion (most dangerous)
The smog layer in Los Angeles Base of inversions
Global effect: Anything released by human beings will be transported globally by atmospheric circulations and ocean circulations
Air Quality Index • The EPA created an index for air pollution monitoring called the Air Quality Index (AQI). • A formula applies to ozone, particulates, carbon monoxide, sulfur dioxide, and nitrogen dioxide by expressing each pollutant on a scale that ranges from 0 to 500. • The official AQI for any location at a particular time is the highest of the five individual pollutant values.
History of air pollution(1) The medieval pollution • In medieval London, pollution from coal burning was seen as such a serious matter that a commission was established in 1285 to investigate the problem. It was reconvened three years later with firm instructions to find a solution. • In 1307, during the reign of Edward I, legislation was introduced to prevent the use of sea coal in kilns and by blacksmiths. It proved largely ineffective.
History of air pollution(2) The 16th – 19th century • Wood for burning became scarce and expensive, and an increasing number of domestic chimneys encouraged an ever-wider use of fossil fuel. • London rapidly changed from a wood-burning city to one that relied on imported coal. By the end of Elizabeth I's reign in 1603, coal consumption in the city had risen to more than 50,000 tons a year. • In 1661, the diarist and proto-environmentalist John Evelyn published a diatribe against air pollution in London:Fumifugium, or The Inconvenience of the Aer and the Smoak of London Dissipated. Image source
History of air pollution(3) The 20th century • The Great Fog of 1952. Cold weather, combined with an anticyclone and windless conditions, trapped the pollution from Thames-side power stations, domestic fires and London's new fleet of 8,000 diesel buses. The total number of fatalities was about 12,000. • The 1948 Donora smog. A warm air pocket had passed high above the town, trapping cooler air below and sealing in pollutants. 14,000 residents experienced severe respiratory and cardiovascular problems. The death toll was nearly 40. • Led to several changes in practices and regulations, including the Clean Air Act 1956. Source
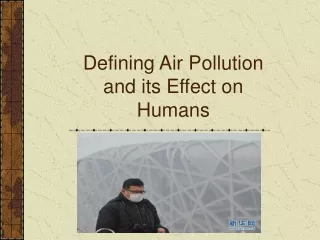
History of air pollution(4) The 21st Century • As China has industrialized, various forms of pollution have increased, which has caused widespread environmental and health problems. According to the World Bank in 2007, 16 of the world's 20 most polluted cities are in China. • Air pollution in India is a serious issue with the major sources being fuelwood and biomass burning, fuel adulteration, and vehicle emission. The 2012 Environmental Performance Index ranked India as having the poorest relative air quality out of 132 countries. Image Source
Summary • Effects of vegetation: (1) makes heat/water reservoir deeper, (2) enhance evaporation, (3) grows and dies in response to environmental conditions • Effects of different surface types: desert, city, grassland, forest, sea. Deeper heat/water reservoir and enhanced convective instability. • Heat island effect. 7 causes • Air pollution. 2 categories. 6 types of major pollutants (particulates, carbon oxides, sulfur dioxides, nitrogen oxides, volatile organic compounds, ozone) • Effect of wind and stability on pollution: Most dangerous is upper level inversion • Air quality index • History of air pollution: The Medieval pollution, The 16th-19th centuries, The 20th century, The 21stcentury