Download
1 / 38
380 likes | 531 Views
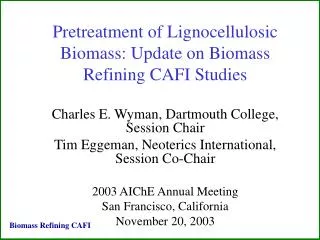
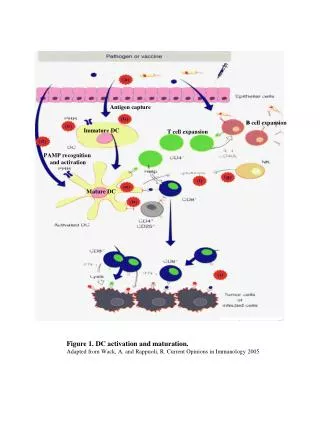
Envisioning Mature Biomass Refining. Mark Laser. Thayer School of Engineering Dartmouth College mark.laser@dartmouth.edu. Joachim Forum. Renewable Bio-based Materials and Fuels Session Milleneum UN Plaza Hotel New York, NY. June 4 – 5, 2007. 77. 77+3+15. 100 x. 100 x. = 69%. = 85%.

E N D
Envisioning Mature Biomass Refining Mark Laser Thayer School of Engineering Dartmouth College mark.laser@dartmouth.edu Joachim Forum Renewable Bio-based Materials and Fuels Session Milleneum UN Plaza Hotel New York, NY June 4 – 5, 2007
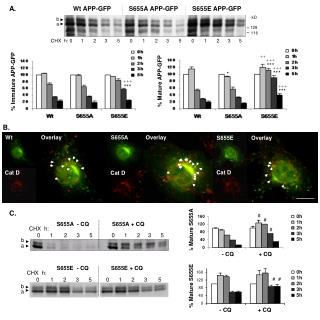
77 77+3+15 100 x 100 x = 69% = 85% 100+ 2.2+9.5+0.4 100+ 2.2+9.5+0.4 Oil Refining Energy Flows • Fuels • Gasoline (42.0%) • Diesel (23.8%) • Jet fuel (8.9%) • LPG (2.6%) 77% 100% 100% 96% Refining TS&D Crude Recovery, TS&D Petrochemicals (3%) • Other • Coke (5.2%) • Residual oil (4.5%) • Asphalt (3.6%) • Lubricants (1.0%) • Other (1.0%) 15% 4.4% (Still gas) 9.5% 2.2% 0.4% Input Mix Diesel 100% 2.9% (FFE) 10.1% (FFE) Input Mix Coal 19% Residual oil 4% Natural gas 71% Electricity 6% Input Mix Crude 1% Residual oil 1% Diesel 15% Gasoline 2% Natural gas 62% Electricity 19% Well-to-Pump Efficiency Sources: External energy inputs/efficiencies: GREET, 2005 Refinery outputs: Energy Information Administration, 2005 All products: Fuels: 2
Biomass Refining ? Refining Biomass Production, TS&D What will we make TS&D ? ? What inputs will be required? What will it cost? And, how big can biorefining be: Niche player or major industry? 3
Multi-sponsor • U.S. Department of Energy • The Energy Foundation • National Commission on Energy Policy Objectives 1) Identify & evaluate paths by which biomass can make a large contribution to future demand for energy services. 2) Determine what can be done to accelerate biomass energy use and in what timeframe associated benefits can be realized. The Role of Biomass in America’s Energy Future (RBAEF) Multi-institutional • Dartmouth College • Natural Resources Defense Council • Argonne National Lab • Michigan State University • National Renewable Energy Lab • Princeton University • Union of Concerned Scientists • USDA Agricultural Research Service • University of Tennessee • Oak Ridge National Lab 4
Importance: More important to know where we can get than where we are to evaluate • Appropriate levels of research effort, policy intensity for biomass-based options. • The potential contribution of biomass to a sustainable world. Framing the Analysis Broad range of technologies (but not all) considered in a common framework. Emphasis on mature technology What: Asympotic state such that further research & experience yield but incremental improvement in cost/benefit realization. e.g. Total expended effort to improve technology is similar to that done for petroleum refining Evaluation: Knowledgeable optimist’s most likely estimate. 5
Basis for Thermodynamic analysis “energy balance” Material flows for environmental analysis Economic analysis ~7 person-year effort undertaken jointly by Dartmouth, Princeton 24 different scenarios including many product combinations • Electrical power • Fischer-Tropsch Fuels • Ethanol • Hydrogen • Dimethyl ether • Animal feed • Light gases Unprecedented for mature biomass conversion technologies RBAEF Process Analysis Material & Energy Balance Models Implemented using Aspen Plus Built on extensive prior work Princeton (thermochemical fuels & power) NREL & Dartmouth (ethanol) 6
Biological Processing • Ammonia Fiber Explosion pretreatment no feedstock degradation and downstream inhibition • Consolidated bioprocessing no dedicated cellulase production • Energy efficient distillation intermediate vapor recompression heat pumps • Extensive water recycle no evaporation of distillation bottoms liquid Thermochemical Processing • Pressurized O2-blown gasifier smaller gasifier sizes • Warm gas clean-up reduced thermal losses • Integrated tar cracking fewer pieces of equipment • Combined cycle gas turbine increased generation efficiency Feedstock • Switchgrass extensive growth area & environ. benefits • Large scale 5,000 – 20,000 dry ton/day • High yield e.g.10 dry ton/acre/year (2X current yield) Key Mature Technology Features 7
Mature Biomass Refining Energy Flows (example scenario) THERMOCHEMICAL Power 3.7% 1.6% Power 3.6% 0.2% 0.9% 0.1% Power 3.7% 3% NH3 1% Steam 10% 5% Steam 10% Steam 10% Steam Turbine HRSG 3% 100% 100% 97% 96% Feedstock 54% Ethanol 2% 1% 17% 1% Pretreatment 0.1% 0.1% Solids 26% Feed Handling Distillation CBP Liquid 16% 2% 9% 6% 19% Power 1% GT 4% 21% 35% 26% Gas Cleanup 27% 27% FT Synthesis Gasification 22% Residue FT Gasoline 6% WWT Sludge 1% FT Diesel 10% Drier Biogas 13% POX WWT Other Utilities Cooling/Heat Loss BIOLOGICAL 0.3% 0.6% Ag Inputs (Farming, feedstock transport) ~ 7 % Energy out/Ag Inputs = 71/7 ≈ 10X 8
Maturation of biological conversion much larger opportunities Current Mature 100% 100% Biological Processing Biological Processing 54% 39% Post-Biological Processing Post-Biological Processing Internal cogeneration - most energy for biological processing is from waste heat accompanying power and/or FT fuel production Fischer-Tropsch fuels (diesel, gasoline) Power Post- Biological Processing Post- Biological Processing Residues Residues 39% 39% FT fuels (16%) Power (17%) Bioprocess (steam, power) Bioprocess (steam, power) 14% 14% power = 0.68 FTfuels = 0.71 0.75% power demand displaced for every 1 % transport fuel demand displaced (US) Slate of fuels including bioethanol, FT diesel, FT gasoline (or added ethanol) Large baseload power contribution, compliments intermittent sources E90 entirely from renewables Thermochemical Processing of Residues Offers Lots of Value 9
Max Fuels 80 77 77 73 71 69 68 64 61 61 61 58 55 49 33 GTCC Rankine EtOH/H2 FT/GTCC H2/GTCC EtOH/GTCC EtOH/Rankine DME/GTCC EtOH/FT/GTCC EtOH/Protein/FT EtOH/FT (1X)/CH4 EtOH/SA/Rankine EtOH/Protein/GTCC EtOH/Protein/Rankine EtOH/FT (w/recycle)/CH4 Current technology (dilute acid pretreatment; SSCF) 36 – 47% Processing Efficiencies 100% 87 90% 80% 73 70 70% 60% Processing Efficiency (%)* 50% 45 40% 30% 20% 10% 0% Corn EtOH Oil Refining (fuels) Oil Refining (total) Oil Refining (fuels + chems) 10 *Defined as energy out/(feedstock + external processing energy); % feedstock LHV basis
Dedicated Power Current US Power Mix Bioethanol (max fuels) and TC Coproducts TC fuels and Power Future US Power Mix Bioethanol and TC Coproducts Current technology (dilute acid pretreatment; SSCF) Comparative Greenhouse Gas Displacement 11
Dedicated Power Current US Power Mix Bioethanol (max fuels) and TC Coproducts TC fuels and Power Future US Power Mix Bioethanol and TC Coproducts Current technology (dilute acid pretreatment; SSCF) Comparative Petroleum Displacement 12
Inputs • Liquid fuel • Fertilizer • Other Nutrient recycle Soil Carbon Accumulation CO2 point source Geo/Ocean Reservoirs Coproducts (e.g. power, feed) CO2 point source CO2 Equivalent Emission (% Gasoline base case, per mile, not cumulative) EtOH & Power EtOH & FT Fuels & Power Primary Cycle 0 0 Inputs +10 +8 Coproducts -56 -4 N recycle -3 -2 Soil carbon accumulation -43 to -159 -33 to -48 CO2 capture, sequestration -128 -48 CO2 Photosynthesis End use Biofuel Biomass Conversion 13
A 24.5% 29.8% remaining A. 1/3 current transport fuel from cellulosic biofuels, coproduce power B 21.2% B. 40% electrical power from carbon- neutral sources C 24.5% C. Triple transportation sector efficiency 45.2% 27.7% 29.8% remaining Aggressive but possible CO2 emission reduction combined with carbon sequestration accompanying biomass production & conversion: 23.3% 21.1% 6.5% -15.4 to 2.1% current emissions Soil carbon Point source Combined Biofuels as Part of Broader Greenhouse Gas Mitigation Strategy An Illustrative Example CO2 Emission Reduction Strategies Total CO2 Emissions Transport & Power Generation Carbon Sequestration Opportunities 14
Analytical Approach: • Estimate capital (NREL, Princeton, vendors, literature) and operating costs • Calculate internal rate of return using discounted cash flow analysis, as a function of: • Fuel & power prices • Scale • Debt-equity ratio and other financial parameters (Can also fix fuel & power prices and calculate IRR) Economics Salient Observation: Cellulosic biomass @ $40/ton = $2.3/GJ = oil @ $13/barrel 15
Scenario Comparison 50% EtOH/Rankine EtOH/GTCC 45% EtOH/FT/GTCC EtOH/FT (1X)/CH4 40% EtOH/FT (w/recycle)/CH4 EtOH/H2 35% EtOH/Protein/Rankine EtOH/Protein/GTCC 30% EtOH/Protein/FT Internal Rate of Return (%) 25% FT/GTCC DME/GTCC 20% H2/GTCC Rankine 15% GTCC 10% 5% 0% $5 $6 $7 $8 $9 $10 $11 $12 $13 $14 $15 Fuel Price ($/GJ) 2002 2003 2004 2005 Crude price: ($61/bbl) ($24/bbl) ($29/bbl) ($37/bbl) ($50/bbl) Gasoline price: ($1.81/gal) ($0.81/gal) ($0.98/gal) ($1.27/gal) ($1.65/gal) $0.04/kWh $0.20/lb protein 40/60 D/E 7.5% loan rate Scale: 5,000 dry short tons/day = 4,535 metric tons/day 16
Scenario Comparison: 5,000 dry tons/day 2002 2003 2004 2005 Crude price: ($24/bbl) ($29/bbl) ($37/bbl) ($50/bbl) Gasoline price: ($0.81/gal) ($0.98/gal) ($1.27/gal) ($1.65/gal) 50% 45% 40% 35% 30% Internal Rate of Return (%) 25% 20% Current EtOH/Rankine (dilute acid pretreatment; SSCF) 15% 10% 5% 0% $5 $6 $7 $8 $9 $10 $11 $12 $13 $14 $15 Price of Competing Fuel ($/GJ) ($61/bbl) ($1.81/gal) Bioethanol (max fuels) and TC coproducts Bioethanol and TC coproducts TC Fuels and power $0.04/kWh $0.20/lb protein 40/60 D/E 7.5% loan rate Power Scale: 5,000 dry short tons/day = 4,535 metric tons/day 17
Scenario Comparison: 5,000 dry tons/day U.S. Average Industrial Price 1996 - 2005 $0.0485/kWh 40% 35% 30% 25% Internal Rate of Return (%) 20% 15% 10% 5% 0% $5 $10 $15 Electricity Price ($/GJ) $0.04/kWh $0.06/kWh $0.07/kWh Bioethanol & TC coproducts Current EtOH/Rankine (dilute acid pretreatment; SSCF) TC Fuels $8.23/GJ fuel price ($1.50/gal gasoline) ($1.00/gal ethanol) ($1.67/gal diesel) $0.20/lb protein 40/60 D/E 7.5% loan rate Power $20 18
Anticipated Features of Mature Biofuel Technology (RBAEF) Efficient • > 70% feedstock energy fuels, power • Fossil fuel displacement ratio (out:in) ≥ 10 • Integrated biological & thermochemical processing key Cost effective • Liquid fuel production cost-competitive with gasoline from oil @ $30/barrel Attractive production/utilization cycles • Near-zero net greenhouse gas emissions • High performance, clean-burning fuels • Large agricultural economy & soil fertility benefits ~ Two dozen cellulosic biomass processing scenarios developed based on performance & configurations anticipated for mature technology • Ethanol, F-T fuels, dimethyl ether, hydrogen, electricity, feed protein • Analyzed in a common framework • Unprecedented 19
Resource Sufficiency: Radically Different Conclusions Large contribution possible & desirable United States • Biomass will eventually provide over 90% of U.S. chemical and over 50% of U.S. fuel production (NRC, 1999, Biobased Industrial Products,). • 20% of petroleum demand in 2025 (Lovins et al., 2004, Winning the Oil End Game). • 1.3 billion tons of biomass could be available in the mid 21st century - 1/3 of current transport fuel demand (Perlack et al., 2005, “Billion Tons Study”). • 50 % current transportation sector energy use, and potentially nearly all gasoline, by 2050 (Greene et al., 2004, Growing Energy) • Goal of 100 billion gallons of ethanol by 2025 (Ewing & Woolsey, 2006, A High Growth Strategy for Ethanol) Worldwide • Biomass becomes the largest energy source supporting humankind by a factor of 2 (Johanssen et al., 1993, Renewables-Intensive Global Energy Scenario). • Biomass potential comparable to total worldwide energy demand (Woods & Hall, 1994; Yamamoto, 1999; Fischer & Schrattenholzer, 2001; Hoogwijk et al., 2005) 20
Resource Sufficiency: Radically Different Conclusions Large contribution not possible and/or not desirable David Pimentel’s group (8 papers, 1979 to 2002) “Use of biomass energy as a primary fuel in the United States would be impossible while maintaining a high standard of living” “Large-scale biofuel production is not an alternative to the current use of oil and is not even an advisable option to cover a significant fraction of it.” Others Power density of photosynthesis is too low for biofuels to have an impact on greenhouse gas reduction (Hoffert et al., 2002) Impractically large land requirements for biomass energy production on a scale comparable to energy/petroleum use (Trainer, 1995; Kheshgi, 2000; Avery, 2006) 2030: Ethanol (corn and cellulose) 2.5% of transportation energy - 2% of this cellulosic (EIA, 2006) Any substantial increase in biomass harvesting for the purpose of energy generation would deprive other species of their food sources and could cause collapse of ecosystems worldwide (Huesemann, 2004) Because of large land requirements, biofuels are not a long-term practical solution to our need for transportation fuels (Jordan and Powell, July 2006, Washington Post) 21
{ VMT 1 - I NNLFP = MPG • YP/F P Understanding the Disparity of Resource Sufficiency Studies The math is simple: { NNLFP: Net new land, ignoring changed land for food production (acres) VMT: Vehicle miles traveled (miles/yr) MPG: Miles/gallon gasolineequivalent YP/F: Process yield (gallons gasoline equivalent/ton dry biomass) I: Feedstock produced from currently-managed lands (ton dry biomass) P: Productivity of biomass production (tons/acre/year) 22
Factors Impacting Biomass Feedstock Availability: Feedstock Productivity (P) 25 Projected 24 15 12.5 Energy Crops U.S., 10 years (R. Hamilton) Energy Crops U.S., Mature (V. Khosla) Energy cane, projected (Botha, Reinach) SG, 2050 (McLaughlin) Richard Hamilton (Ceres) “[Available information]…strongly suggest[s] that over the next decade or so the deployment of modern breeding technologies will result in average energy yields of at least 15 tons per acre, and that these averages can be sustained across a broad range of geographic and environmental conditions, including the approximately 75 million acres of crop and pasture land in the United States that could easily be converted to their cultivation without impacting domestic food production.” 30 Current 25 20 16.5 Productivity (tons/acre/yr) 15 7.5 10 5 5 1.3 0 Miscanthus (Heaton & Long) Pimentel et al. (2002) Current SG (McLaughlin) Corn Whole plant U.S. Ave. Heaton and Long: 3 site average in Illinois over 2 years, direct comparison with switchgrass (Cave-in-Rock), which averaged 4.6 tons/acre/yr 23
Land Area Required for Current U.S. Light Duty Mobility in Relation to Vehicle Efficiency High Vehicle Efficiency A central feature of all sustainable transportation scenarios Battery/EV; H2/fuel cell: Avoids otherwise small travel radius Cellulosic biofuels Avoids otherwise large footprint Land used 160 for animal feed 140 120 100 Land Area (Millions of Acres) Without Residue Utilization 80 60 Idled by federal programs, mid 80s- mid 90s 40 CRP 20 With Residue Utilization 0 1 2 3 4 5 6 Vehicle Efficiency Multiplier •LDV VMT = 2.5 trillion vehicle miles traveled •Waste availability: 200 million dry tons •Switchgrass productivity: 10 dry tonss/acre/year (20 to 30 year projected average, tentative) •Fuel yield: 100 gallons/dry ton 24
Factors Impacting Biomass Feedstock Availability: Integrating Feedstock Production Into Currently-Managed Land (I) Hasn’t happened in the past. Farmers would rethink what they grow and how they grow it. Feed protein/feedstock coproduction Feedlot pretreatment to make calories more accessible Increase production on under-utilized land (e.g. hay, pasture) Winter cover crops Agricultural residue removal, enhanced by appropriate crop rotations Food production is usually assumed to remain static in analyses of biomass supply. New demand for non-nutritive cellulosic biomass due to cost-competitive processing technology would very likely result in large changes. 25
Feed Protein/Feedstock Coproduction Concept Feed Protein Fuels/ Chemicals Switchgrass Protein Recovery/ (& Pretreatment) Composition & productivity comparison Crop Protein (Mass Fraction) Protein Productivity (tons/acre/year) Mass Productivity (tons/acre/year) Switchgrass 5.0 – 10 .08 -0.12 (early cut) 0.4 – 1.2 Soybeans 1.1 – 1.3 0.36 - 0.5 (bean only) 0.40 – 0.65 • Production of perennial grass could potentially produce the same amount of feed protein per acre while producing a large amount of feedstock for energy production • Requires readily foreseeable processing technology to recover feed protein • Many positive indications of feed protein quality, but not fully established • Not pursued now because of absence of demand for cellulosic residues • Cellulosic feedstocks might also be coproduced from large biomass soybeans Processing 26
New uses for existing crops (e.g. corn stover) New combinations of existing crops New & improved crops & cropping systems Invited paper for Global Change Biology Lee Lynd, Mark Laser, Kara Podkaminer (Dartmouth) Rob Anex, Andy Heggenstaller, Matt Leibman (ISU) Bruce Dale (Michigan State University) David Bransby (Auburn University) Nathanael Greene (NRDC) Housein Shapouri (USDA) John Sheehan (NREL) Reimagining Agriculture to Accommodate Large Scale Energy Production New demand new rewards & opportunities new agriculture This new agriculture has received only scant investigation worldwide Different solutions will be most practical in different local situations 27
{ VMT 1 - I NNLFP = MPG • YP/F P 6.1 4.5 1.4 VMT (trillion miles, 2050) “Car Talk” scenarios 21 2.4 50 MPG (LDV) Current—D. Friedman 36 2.5 YP/F (gallons/ton) 91 Recent NREL—RBAEF Infinite I (million tons) 0 600 Many—“Billion Tons” 12 P (tons/acre/year) D. Pimentel—V. Khosla 1.3 24 NNLFP(million acres) 14 381 5,328 Returning to that simple equation… { Ratio Source Least Efficient Most Efficient Parameter (Max/Min) (High, Low) 28
1,030 Status quo Advanced processing 410 Vehicle efficiency 2.5X↑ 165 Biomass yield 2.5X↑ 65 91 gal Geq/ton Agricultural integration I. Soy switchgrass or large biomass soy Early-cut switchgrass produces more feed protein/acre than soy; similar benefits from “large biomass soy” -10 II. Corn stover (72%) -50 Feasibility of stover utilization enhanced by rotation 36 gal Geq/ton, current mpg, no ag. integration, 5 tons/acre*yr Winter cover crops, other residues, increased productivity of food crops, increased production on under-utilized land… ?? III. Other New Land Required to Satisfy Current U.S. Mobility Demand CRP Land (30 MM) U.S. Cropland (400 MM) LDV HDV 0 200 400 600 800 1,000 1,200 New Land Required (million acres) 29
Biomass Resource Sufficiency: Summary Observations Primarily behavioral (diet, exports, VMT) 80 million acres currently devoted to producing export crops has a biofuel production potential of 110 billion gal GE Shifts in meat consumption could make available ~60 million acres, with a corresponding biofuel production potential of 82 billion gallons GE of fuel Both technological & behavioral (MPG, integration of feedstock production into managed land) Integration potential, on the order of 600 million tons, could produce 55 million gallons GE with no new land required Technically-possible mileage increases could decrease fuel demand by 2.5-fold Multiple complimentary changes Becomes realistic to consider meeting all U.S. mobility demand from biofuels, with some scenarios requiring little if any new land to achieve this Illustrative Large Impacts Category of Change Primarily technological (process yield, crop productivity) Anticipated improvement in process yield & energy crop productivity together would increase per acre biofuel yield by ~ 10-fold (1715 gal gasoline equivalent, GE, per acre) Increased productivity of food crops could substantial acreage of existing cropland available for energy crops 30
Pulp & Paper as Entry Point for Cellulosic Ethanol? • Several studies suggest that co-producing ethanol with pulp and paper can be economically attractive: • Fan & Lynd, 2007. Bioprocess Biosyst Eng; 30:35-45 • Lynd, 2004. Industrial Bioprocessing; 26(5):7 • Furstein, S.J. et al., 2003. TAPPI Proceedings; pp. 262-271 • Kerstetter et al., 1997. NREL subcontract ACG-6-15177-01 • In January 2007, Flambeau River Papers announced plans produce 20 MGY from spent pulping liquor in Park Falls, Wisconsin as soon as 2009. • In April 2007, Weyerhaeuser signed LOI with Chevron to jointly assess the feasibility of commercializing cellulosic ethanol 31
Common Threads: Policy R&D Education/Communication 32
} • Research, development, demonstration Simultaneous, consistent with • Commercialization • Niche applications • Corn ethanol, gasoline price gap Cumulative cost (10 years): ~$2 billion • Desired rapid deployment Additional supporting policies Renewable fuel standard, becoming performance-based over time, require FFVs Aggressive policies supporting vehicle efficiency Build a new agricultural-environmental coalition RBAEF Policy Recommendations Policy package developed by NRDC with input from UCS & others 2015: Billion gallons of cellulosic biofuels, cost-competitive (oil @ $30/bbl) 33
Three levels of activity Applied fundamentals (15% of funds) Innovation (35% of funds) Demonstration (pilot, 50% of funds) All three focus areas are prime targets, especially diverse approaches to overcoming the recalcitrance of cellulosic biomass Are many promising options for which pilot work is appropriate now Example: AFEX for feed, pretreated feedstock production However, the best pilot plants are ones that we cannot afford to shut down, and there are opportunities there too that have been overlooked Paper sludge conversion RBAEF Recommendations: RD&D Research, Development & Demonstration ($1.1 billion, 6 years) Three focus areas Overcome the recalcitrance of cellulosic biomass - Primary economic barrier Product diversification (various fuels, chemicals, power, feed) Advanced feedstock production (productivity, environmental, economics) 34
Approach Reduce barriers but do not replace private-sector due diligence. Menu of incentives. Bond & efficacy insurance - feedstock supplier, producer, product purchaser Production incentive - first 5 years Graduated pools with caps on % cost, value of plant, total available Recommendations: Commercialization Amount $0.8 billion over 10 years Objectives Encourage production of sufficient capacity that, in combination with RD&D, production costs can approach that of conventional fuels by 2015. Minimize risk of unproductively spending public funds. A self-sufficient, growing, industry when policies expire. 35
Policy Progress Energy Policy Act 2005 • Renewable Fuels Standard: 7.5 billion gallons in 2012 • 250 annual million gallons cellulosic ethanol by 2013 • Biomass R&D: $200 million per year 2006 – 2015 • Cellulosic biofuels production incentives: $250 million over 10 years; 1 billion gallons by 2015 DOE Commitments 2007 • Up to $385 million to 6 commercial projects; 130 million total gallons • Up to $200 million over 5 years; 5 – 10 demonstration plants Whitehouse Proposal 2007 • 20 in 10: reduce gasoline consumption by 20% in next 10 years • 35 billion gallons of renewable and alternative fuels in 2017 36
R & D Focus? Increase hydrolysis yield 3% Improved biomass sugars 13% Halve cellulase loading R&D-Driven Improvements Eliminate pretreatment 22% Consolidated bioprocessing (CBP) 41% Simultaneous C5 & C6 Use 6% Improved sugars product Increased fermentation yield 2% Increased ethanol titer 11% 0% 10% 20% 30% 40% 50% Increased ethanol titer following CBP 7% Processing Cost Reduction 37
Education/Communication? • Communication of the cellulosic biofuels concept has already entered the mainstream public lexicon: • President Bush has mentioned the subject in his past 2 state of the union addresses. • Google search on cellulosic ethanol yields 1.1 million links • Efforts are underway to develop curricula to prepare students for a future economy centered around cellulosic biomass: • Michigan State University’s Multidisciplinary Graduate Training Program on Technologies for a Biobased Economy • Michigan Biomass Curriculum Project • BioSUCCEED — Bioproduct Sustainability, a University Cooperative Center of Excellence in Education • Wisconsin Biomass K-12 Biomass Education 38