email :
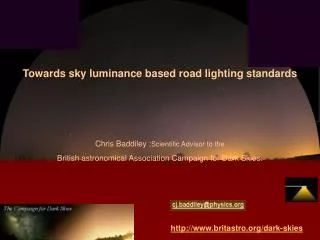
Towards sky luminance based road lighting standards Chris Baddiley : Scientific Advisor to the British astronomical Association Campaign for Dark Skies. email :. http://www.britastro.org/dark-skies. Nockalm pass, Austria, all sky.

email :
E N D
Presentation Transcript
Towards sky luminance based road lighting standards Chris Baddiley :Scientific Advisor to the British astronomical Association Campaign for Dark Skies. email : http://www.britastro.org/dark-skies
Nockalm pass, Austria, all sky Nockalm pass Austria, at 1.9Km altitude, 2007-10-07, 8mm fisheye lens. Canon 350D ir extended block. Zodiacal light and Gegenschein were just visible. Darkest location in the Alps, still light pollution clearly visible from towns 40km distant and more.
Visibility limit map for Cotswolds Dark sky areas of the Cotswolds (P. Cinzano / F Falchi ISTIL- Dipartimento di Astronomia Padova, Italy), Philips – Maps publication for CfDS, 2004 September
Analysis picture Skyglow in the Cotswolds CCD composite of 20 x15 second exposures. Cotswold Hills, 6 miles south of Cheltenham. It can be seen, perhaps aided by the rising early morning mist, that a glow can be seen all around the horizon, particularly at 12 o' clock. Location SO967102 (Cheltenham), 7 o'clock (Cirencester). By James Weightman, BAA Made from 12 images covering the whole sky taken with wide angle zoom 7 mm fl lens, setting of Casio QV3500 digital camera over a period of approx 15 minutes.
Direct and reflected rays diagram Air molecules Reflected Skyglow is caused by the downward scattering of upward light by air molecules and also aerosols, mostly water droplets and dust. The longer the path length through the lowest part of the atmosphere, the more the scattering. Light that goes straight up is mostly reflected, and has shorter paths through the lower scattering layers. The low angle light is mostly directly radiated, and it is this that causes most of the sky glow well away from the source. Aerosols Radiated.
Low pressure sodium, SOX High pressure sodium (SON) wide angle Shallow bowl High pressure sodium (SON) Full Horizontal Cutoff (FCO /HCO) Luminaire polar plots Distance from centre represents luminance in that direction 180 Gamma 0 to180 Vertical 0 0 C angle 0 to 360 or 0 to 270, -90 to 0 270 90 180 Road from above
Luminaires polar plot gamma and C SOX SOX Luminaire vertical polar (all gammas) distribution along the road (orange, C=0/180) and across the road (purple, C=270/90) Luminaire azimuth (all C angles) polar distribution profile at gammas from 10 (white) to 90 degs (tan, horizontal) Full cutoff SON Full cutoff SON
Surface reflectivity vs angle Reflectivity as a function of angle of incidence to normal. Reflectivites of surfaces increase towards grazing incidence. Smooth surfaces go to unity. The Brewster angle is before this which blocks the horizontally polarised components. Most surfaces, even roughness are very reflective beyond 70 degrees, i.e. below 20 degrees to the horizontal. Low angle light is reflected, smooth ones become a mirror. Grass reflectivity 0.1 Rises to 0.2 at 80 degrees, asphalt goes from 0.04 to 1 at grazing angle, as does water Reflectivity of grass as a function of angle of incidence to normal.
Surface reflectivity spectrum Reflectivities vary with wavelength. Grass is less reflective in yellow. Switching to white light increases its value. The minimum reflectivity is at about 670 nm where light is absorbed by photosynthesis, in common with all vegetation. Reflectivities rise rapidly in the near infrared for thermal rejection. Reflectivities: at 589 nm wavelength Soil 0.1 Grass 0.08 Foliage 0.06 Asphalt 0.04to 0.08 (dirty) Concrete 0.25
Surface specular and scatter reflection Surface scatter according to roughness, follows the projected surface area in viewed direction (cosine of the view to surface normal angle) Incident light to a surface is reflected and scattered thus :- A small amount of back scatter from double retro-reflections between surface facets. Specular reflection, angle of reflection = angle of incidence, small amount of spread for surface facet tilt variations. Surface scatter according to roughness, follows the projected surface area in viewed direction (cosine of the view to surface normal angle) Incident light. Small amount of back scatter from double retro-reflections between surface facets Specular reflection, angle of reflection = angle of incidence, small amount of spread for surface facet tilt variations
Surface specular and scatter reflection Bi-directional Reflectance Distribution Function (BRDF) Scatter Specular Scatter Bi-directional Reflectance Distribution Function Showing dependence of scatter on cosine of incidence and cosine of view projection angle, and specular reflection near 1-cosine dependence on incidence angle (near Lambertian), increasing towards grazing. Back Scatter Back Scatter Specular Small incidence to normal angles Large incidence to normal angles
Direct : Csource = Cview, Gsource = Gview Ground reflect : Csource = Cview, Gsource = 180 - Gview Gnd & wall reflect : Csource = 360 - Cview, Gsource = 180 - Gview Upper wall reflect : Csource = 360 - Cview, Gsource = Gview Wall reflected to same view direction Direct radiated to view direction Wall and ground reflected to same view direction (may be wall reflected) Ground reflected to same view direction (likely wall reflected) Direct and surface reflected rays diagram for above horizontal low gamma view Direct upward, back ground with wall reflected, and upper back wall reflected routes (three routes). Note the front ground reflected one is blocked, and so appears as a back one mapped to the opposite view direction. Address mapping is used to find all routes from source to view direction. Shown here after the source ray traces have been re-grouped to the same view direction.
Luminaires reflection scatter and direct upward radiance polar plots Cut off For C angles at gammas of 90,100,110,120,130,140,150,160,170,180 SOX Direct and reflected (specular and scatter) and combination Full cutoff SON For gamma from 90 to 180 at C angle 0-180 and 90-270.
Scatter probability Scatter probability for scatter angle (phase function).Light from below is scattered in the direction of the grid angles. The distance from the centre curve gives the probability of scatter in that direction. The probability over all angles is set at 1, (100%), and must be multiplied by the scattering density. Rayleigh scattering from air molecules.Equal probability forwards and backwards, 50% of that sideways. Intensity varies as wavelength ^4 (blue biased). It is why the sky is blue by day. Mie scattering from aerosols (Heye-Greenstein function with added back scatter). The forward scatter is very peaked, increasing with particle size from 1nm to 10 microns. There is practically no sideways scatter and back scatter is tiny. No wavelength dependence. It is why clouds and snow are white. The lower scatter probability profile is the one used.
Atmospheric scattering pictures Mie scattering by aerosols.. water droplets and dust, similar or larger than the wavelength of light. No wavelength dependence and very directional. Note when the Eiffel tower beam is orthogonal, seen by its scatter, it disappears. (here shown near beam on) Daylight Rayleigh scattering by air molecules, smaller than the wavelength of light. Equal forward and backward scatter, also sideways, Varies as 1 / wavelength 4
Sunset scatterring simulation Sun Elev. 0 o -2.5 o -5 o Sky scatter from Sun (sun omitted) with elevation (//webexhibits.org/causesofcolor/14B.html) Rayleigh scatter air moleculesMie scatter from aerosolsTotal Scatter .
Scatter density with altitude The variation of density of air molecules and aerosols, as a function of altitude in the atmosphere. At 10 km altitude the density off the air has reduced to 2/3 of its ground value. The equivalent height of the total atmosphere brought to constant density is only a few km.
Path geometry Viewing from a distance (10’s of Km) . Due to the limited height of atmosphere, the path geometry is dominated by shallow angles. Aerosols scatter efficiently at shallow angles. While at the zenith of the view location, the scatter is at right angles where aerosols do not scatter, and so scattering is then due to air molecules. Effective limited height of atmosphere
Line of sight cone of view projection to source view path and scatter path increment A unit cell in a cone of sky from the viewer is seen to project side and front to the source, according to the scatter point location. All increments along the viewpath are summed. view path increment Scatter angle Cell Scatter path Source path distance view path distance Projection area back and side Scatter Height (sets density) 1m2 projection area Source gamma View elevation
Scatter into line of sight for at an view elevation All large scatter angles, mostly scatter from molecules Skyglow at an elevation, the sum of all the scattering for all increments along the path. Skyglow at close distance, <2 Km is dominated by ground reflection, but at increasing distance it becomes dominated by low angle light from above the horizontal Scatter at low angles is from aerosols. Scatter at large angles it is mostly by air molecules, maximally in the blue. Little is from the upper parts of the path, as there the scattering is orthogonal or back scatter and the aerosol density is much lower. Forward scatter from aerosols, dominating at low angles, peak forward of source Ground scatter and specular reflection Ground scatter reflection Direct radiance View elevation
Globelight stepped gamma cutoff polar plots Globe light stepped 0 -180 degree gamma cutoff, vertical polar distribution
Sky glow luminance for a globe light of variable cutoff / that of no cutoff, at 10 km Below horizontal Above horizontal Ratio of skyglow luminance to no cutoff, vs. cutoff gamma angle seen at 10 km, from a globe light with stepped cutoff gamma from 0 to 180 degs, for each elevation. A very sharp increase as cutoff raises above horizontal.
Log plot Relative contribution to sky luminance from a globe light of variable gamma cutoff; mean of all view elevations scaled to 100% for no cutoff. Light Pollution minisation Orange: The differential in sky luminance compared to no cut-off as the contribution for an increment per 5° change in gamma cut-off angle for each gamma. Red: The cosine/sine corrected case; because with the Globe light obviously the Maximum solid angle for any sector is that at gamma 90°, effectively along the Equator thinking of it in terms of sector bands at a given gamma angle… this removes the cosine angle contribution and would represent a same unit size solid angle beam for example at each gamma. Yellow: The integral, total to a given gamma cutoff.
Relative contribution to sky luminance from a globe light of variable gamma cutoff; mean of all view elevations scaled to 100% for no cutoff. Light Pollution minisation Orange: The differential in sky luminance compared to no cut-off as the contribution for an increment per 5° change in gamma cut-off angle for each gamma Yellow: The integral, total to a given gamma cutoff.
Relative contribution to sky luminance from a globe light of variable gamma cutoff; mean of all view elevations scaled to 100% for no cutoff. Light Pollution minisation Orange: The differential in sky luminance compared to no cut-off as the contribution for an increment per 5° change in gamma cut-off angle for each gamma. Red: The cosine/sine corrected case; because with the Globe light obviously the Maximum solid angle for any sector is that at gamma 90°, effectively along the Equator thinking of it in terms of sector bands at a given gamma angle… this removes the cosine angle contribution and would represent a same unit size solid angle beam for example at each gamma.
Log plot schematic, Relative contribution at 5 degree incrementals, for each increment, to sky luminance from a globe light of variable gamma cutoff; mean of all view elevations scaled to 100% for no cutoff. Light Pollution minisation
Professional lighting engineer Educational courses (UK). • To make summary of findings as educational tool in lighting engineer qualification courses and continuous professional development. • Form a central CfDS website of material with links from professional lighting bodies. • Self certification interactive training tool.
IDA / IESNA : Model Lighting Ordinance is adopting this model • The International Dark-Sky Association (IDA) and the Illuminating Engineering Society of North America (IESNA) Joint Task Force is developing a Model Lighting Ordinance (MLO) to address the need for strong, consistent outdoor lighting regulation in the United States. • IDA is leading the development of the MLO; • while IESNA is leading the development oftheaccompanying Design Guide. • Adoption of this atmospheric bias model is in progress.
CIE adopted alternative trough model • The CIE road lighting standards committee have adopted a trough Lambertian model for city centres, advocating curved tempered glass shallow bowls, refuting astronomers wishes for flat glass. • No ray tracing, no atmospheric scattering or path geometry in model. Papers are being produced about this.
Diagram of scatter into line of sight,at 45 degs elevation, as function of distance from the source. Effective limited height of atmosphere Air molecules scatter but there are few of them Skyglow at 45 deg. elevation, as a function of distance from the source. Ground reflection Scatter from Aerosols dominate 45 deg. View elevation Direct radiance (SOX)
Sky luminance, at 45 degs elevation, as function of distance from the source, for SOX, SON cutoff and SON FCO SOX SON CO At >10 km, gradient ~ -2.5 Surface brightness falls as 1/distance 2.5 (Walker’s law) SON FCO Sky luminance along a 45 degree elevation path in the direction of a source as a function of source distance. Reflection for grass. Luminaires types SOX (orange) and cutoff SON (light orange) and full cutoff (pink). (normal incidence reflectivity 0.1). Scatter just from molecules (dots) and molecules with aerosols (lines) respectively. Walker’s law has the brightness fall as 1/distance^2.5 (a constant slope on this plot), but here the slope increases with distance.
Sky glow luminance in line of sight for all elevations, for SOX, SON cutoff and SON FCO at 10 km SOX SON CO SON FCO Sky glow luminance from a source 10 km away, for elevations from horizon to horizon. Luminaires types SOX (orange) and cutoff SON (light orange) and full cutoff (pink). (normal incidence reflectivity 0.1). Scatter just from molecules (dots) and molecules with aerosols (lines) respectively. Aerosols dominate at low elevations.
Effect of Luminaire type:- LPS SOX, HPS SON cutoff, SON Flat glass
Effect of changing bowl type:- polycarbonate bowl, curved glass, flat glass
Light Pollution minisation A B Diagram to show relative impact of a luminaire’s output with regards to contribution to skyglow. A 180-100° Critical area for skyglow from within urban areas but proportionally less impact to rural areas. B 100-95° Significant contributor to skyglow, especially in rural areas where it is most aerosol dependent. Less likely to be obstructed. C 99-90° Critical zone for skyglow and obtrusion seen at 10s of km (in rural areas) where it is strongly dependent on aerosol scattering. D 90-70° Significant contributor to skyglow seen at a distance through reflection but reflected light more likely to be obstructed by buildings, trees and topography. E 70-0° Ideal light distribution. (End) C D E