Download

1 / 24
240 likes | 372 Views
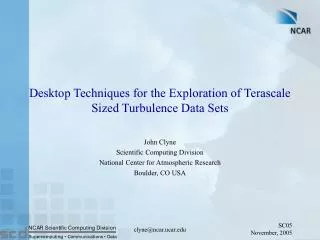
Desktop techniques for the exploration of terascale size, time-varying data sets. John Clyne & Alan Norton Scientific Computing Division National Center for Atmospheric Research Boulder, CO USA. National Center for Atmospheric Research.

E N D
Desktop techniques for the exploration of terascale size, time-varying data sets John Clyne & Alan Norton Scientific Computing Division National Center for Atmospheric Research Boulder, CO USA clyne@ncar.ucar.edu
National Center for Atmospheric Research More than just the atmosphere… from the earth’s oceans to the solar interior Turbulence The Sun Space Weather Atmospheric Chemistry Climate Weather clyne@ncar.ucar.edu
Goals • Improve scientist’s ability to investigate and understand complex phenomena found in high-resolution fluid flow simulations • Accelerate analysis process and improve scientific productivity • Enable exploration of data sets heretofore impractical due to unwieldy size • Gain insight into physical processes governing fluid dynamics widely found in the natural world • Demonstrate visualization’s ability to aid in day-to-day scientific discovery process clyne@ncar.ucar.edu
Problem motivation:Analysis of high resolution numerical turbulence simulations • Simulations are huge!! • May require months of supercomputer time • Multi-variate (typically 5 to 8 variables) • Time-varying data • A single experiment may yield terabytes of numerical data • Analysis requirements are formidable • Numerical outputs simulate phenomena not easily observed!!! • Interesting domain regions (ROIs) may not be known apriori • Additionally… • Historical focus of computing centers on batch processing • Dichotomy of batch and interactive processing needs • Currently available analysis tools inadequate for large data needs • Single threaded, 32bit, in-core algorithms • Lack advanced visualization capabilities • Currently available visualization tools ill-suited for analysis clyne@ncar.ucar.edu
And furthermore… [Numerical] models that can currently be run on typical supercomputing platforms produce data in amounts that make storage expensive, movement cumbersome, visualization difficult, and detailed analysis impossible. The result is a significantly reduced scientific return from the nation's largest computational efforts. clyne@ncar.ucar.edu
A sampling of various technology performance curves • Not all technologies advance at same rate!!! clyne@ncar.ucar.edu
504x504x2048 5 variables (u,v,w,rho,temp) ~500 time steps saved 9TBs storage Six months compute time required on 112 IBM SP RS/6000 processors Three months for post-processing Data may be analyzed for several years Example: Compressible plume dynamics M. Rast, 2004. Image courtesy of Joseph Mendoza, NCAR/SCD clyne@ncar.ucar.edu
Visualization and Analysis Platform for oceanic, atmospheric, and solar Research (VAPoR) Key components • Domain specific • numerically simulated turbulence in the natural sciences • Data processing language • Data post processing and quantitative analysis • Advanced visualization • Identify spatial/temporal ROIs • Multiresolution • Enable speed/quality tradeoffs Combination of visualization with multiresolution data representation that provide sufficient data reduction to enable interactive work on time-varying data This work is funded in part through a U.S. National Science Foundation, Information Technology Research program grant clyne@ncar.ucar.edu
Geometry Reduction(Schroeder et al, 1992; Lindrstrom & Silva, 2001;Shaffer and Garland, 2001) Wavelet based progressive data access Mathematical transforms similar to Fourier transformations Invertible and lossless Numerically efficient forward and inverse transform No additional storage costs Permit hierarchical representations of functions See Clyne, VIIP2003 Reduce Transform (e.g. Iso, cut plane) Reduce Data Source Analyze & Manipulate Text, 2D graphics Multiresolution Data Representation geometry data Pixels Render Visualization Pipeline • Data reduction(Cignoni, et al 1994; Wilhelms & Van Gelder, 1994; Pascucci & Frank, 2001; Clyne 2003) clyne@ncar.ucar.edu
Visual data browsing Refine Coarsen Quantitative analysis Data manipulation Putting it all together • Visual data browsing permits rapid identification of features of interest, reducing data domain • Multiresolution data representation affords a second level of data reduction by permitting speed/quality trade offs enabling rapid hypothesis testing • Quantitative operators and data processing enable data analysis • Result: Integrated environment for large-data exploration and discovery Goal: Avoid unnecessary and expensive full-domain calculations • Execute on human time scales!!! clyne@ncar.ucar.edu
Compressible Convection M. Rast, 2002 1283 5123 clyne@ncar.ucar.edu
Compressible plume Compressible plume data set shown at native and progressively coarser resolutions Resolution: Problem size: 504x504x2048 Full 252x252x1024 1/8 126x126x512 1/64 63x63x256 1/512 clyne@ncar.ucar.edu
Interactive!! Rendering timings 5123 Compressible Convection 5042x2048 Compressible Plume SGI Octane2, 1x600MHz R14k SGI Origin, 10x600MHz R14k Reduced resolution affords responsive interaction while preserving all but finest features clyne@ncar.ucar.edu
p: pressure : density T: temperature : ionization potential : Avogadro’s number me: electron mass k: Boltzmann’s constant h: Planck’s constant Derived quantities Derived quantities produced from the simulation’s field variables as a post-process clyne@ncar.ucar.edu
Calculation timings for derived quantities SGI Origin, 10x600MHz R14k Note: 1/2th resolution is 1/8th problem size, etc Deriving new quantities on interactive time scales only possible with data reduction clyne@ncar.ucar.edu
Error in approximations • Error is highly dependent on operation performed • Algebraic operations tested introduced low error even after substantial coarsening • Error grows rapidly for gradient calculation • Point-wise error gives no indication of global (average) error Point-wise, normalized, maximum, absolute error clyne@ncar.ucar.edu
Full domain seen from above Full domain seen from above Subdomain from side Subdomain from side Integrated visualization and analysis on interactively selected subdomains: Mach number of the vertical velocity Efficient analysis requires rapid calculation and visualization of unanticipated derived quantities. This can be facilitated by a combination of subdomain selection and resolution reduction. Vertical vorticity of the flow
A test of multiresolution analysis: Force balance in supersonic downflows Resolution Full Half Subdomain selection and reduced resolution together yield data reduction by a factor of 128 Sites of supersonic downflow are also those of very high vertical vorticity. The core of the vortex tubes are evacuated, with centripetal acceleration balancing that due to the inward directed pressure gradient. Buoyancy forces are maximum on the tube periphery due to mass flux convergence. The same interpretation results from analysis at half resolution.
Summary • Presented prototype, integrated analysis environment aimed at aid investigation of high-resolution numerical fluid flow simulations • Orders of magnitude data reduction achieved through: • Visualization: Reduce full domain to ROI • Multiresolution: Enable speed/quality trade-offs • Coarsened data frequently suitable for rapid hypothesis testing that may later be verified at full resolution clyne@ncar.ucar.edu
Future work • Quantify and predict error in results obtained with various mathematical operations applied to coarsened data • Investigate lossy and lossless data compression • Add support for less regular meshes • Explore other scientific domains • Climate, weather, atmospheric chemistry,… clyne@ncar.ucar.edu
Future??? Original 20:1 Lossy Compression clyne@ncar.ucar.edu
Steering Committee Nic Brummell - CU, JILA Aimé Fournier – NCAR, IMAGe Helene Politano - Observatoire de la Cote d'Azur Pablo Mininni, NCAR, IMAGe Yannick Ponty - Observatoire de la Cote d'Azur Annick Pouquet - NCAR, ESSL Mark Rast - NCAR, HAO Duane Rosenberg - NCAR, IMAGe Matthias Rempel - NCAR, HAO Yuhong Fan - NCAR, HAO Developers Alan Norton – NCAR, SCD John Clyne – NCAR, SCD Research Collaborators Kwan-Liu Ma, U.C. Davis Hiroshi Akiba, U.C. Davis Han-Wei Shen, Ohio State Liya Li, Ohio State Systems Support Joey Mendoza, NCAR, SCD Acknowledgements clyne@ncar.ucar.edu
Questions??? http://www.scd.ucar.edu/hss/dasg/software/vapor clyne@ncar.ucar.edu