Download
1 / 27
270 likes | 395 Views
Quality Initiatives. Renaissance Gardens March 16, 2006. History. Early 2002, Erickson had 4 Renaissance Gardens facilities Each had separate policies & practices No way to compare standards of care Growth plans to double facilities by 2007

E N D
Quality Initiatives Renaissance Gardens March 16, 2006
History • Early 2002, Erickson had 4 Renaissance Gardens facilities • Each had separate policies & practices • No way to compare standards of care • Growth plans to double facilities by 2007 • Limited Corporate resources in place to support growth
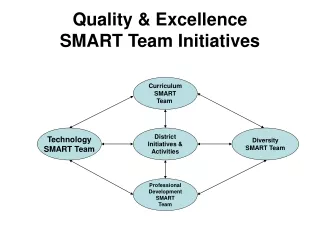
Health Services Team • Create standardized tools to assist Corporate and Community Renaissance Gardens Teams to effectively monitor industry quality indicators • Serve as a foundation for future growth and expansion
Clinical Benchmarking • Focuses on performance improvement processes • Early identification of trends • Educates campus leadership team on Renaissance Gardens practice • Foundation for new initiatives
Benchmarking Benefits • Comparison of Quality Measures across the company • Comparison of data from each Renaissance Gardens in a consistent manner • Evaluate effectiveness of current initiatives and programs • Early implementation of interventions
Types of Data Collected • Medicare Utilization & Census Information • Staffing Hours Per Patient Day (HPPD) • Industry Quality Measures • Falls • Pressure Ulcers • Weight Loss • Restraint Use • Erickson ‘specific’
The Data Reports • How each individual facility performs in key areas • Where there are ‘problem spots’ • How Erickson compares to National and industry standards and to each other • Monitoring special programs’ effectiveness
Benchmarking Review • Monthly submission of Benchmarking Report to Corporate • Corporate report compiled and posted on company’s intranet site • Monthly review by Corporate with each facility’s NHA, DON, ED and Medical Director
Mock Survey • Modeled after State Survey process • Ensure Community is in compliance with all regulations • Ensure/validate positive resident outcomes • Educate staff on appropriate survey/staff interactions
Mock Survey Benefits • Identify problems early so the QI efforts can be focused • Objectively measures care • Prepares Community for upcoming surveys • Improves survey outcomes • Educates staff on survey processes
Falls • In 2003, National Falls rate was 10% (per 1000 RCD) • Erickson average over past 3 years is 9.2%
Pressure Ulcers • National Average is 5% of residents with in-house acquired pressure ulcers • Erickson average over past 3 years is 4.6%
Weight Loss • Industry standard of 7% of residents with unplanned weight loss • Erickson average over past 3 years is 1.7%
Restraints & Devices • National average is 8 per 1000 RCD • Erickson Average for past two years is 2.7%