Educational Needs Index Project Selected Oklahoma Highlights
320 likes | 525 Views
Educational Needs Index Project Selected Oklahoma Highlights. Houston D. Davis, Ph.D., Oklahoma State Regents for Higher Education Brian E. Noland, Ph.D., West Virginia Higher Education Policy Commission Patrick Kelly, National Center for Higher Education Management Systems.

Educational Needs Index Project Selected Oklahoma Highlights
E N D
Presentation Transcript
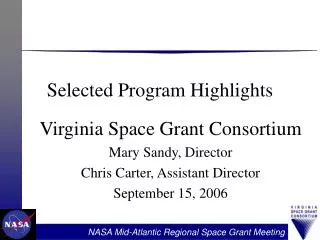
Educational Needs Index ProjectSelected Oklahoma Highlights Houston D. Davis, Ph.D., Oklahoma State Regents for Higher Education Brian E. Noland, Ph.D., West Virginia Higher Education Policy Commission Patrick Kelly, National Center for Higher Education Management Systems
Additional thanks to: Tennessee Higher Education Commission West Virginia Higher Education Policy Commission Oklahoma State Regents for Higher Education National Center for Higher Education Management Systems Austin Peay State University This research is sponsored by:
50% 41.0% 40% 37.6% 37.0% 36.8% 35.2% 35.0% 34.1% 33.9% 33.1% 32.8% 32.6% 32.0% 31.9% 31.0% 30.9% 30.8% 30.5% 29.5% 29.6% 29.3% 29.1% 28.8% 30% 28.1% 27.8% 27.5% 27.4% 27.2% 27.2% 27.1% 26.8% 26.7% 26.6% 26.6% 26.4% 26.2% 25.8% 25.7% 25.7% 25.6% 25.3% 24.6% 24.1% 23.8% 23.7% 23.4% 22.9% 20.6% 20.3% 19.7% 19.4% 20% 17.8% 10% 0% Utah Ohio Iowa Illinois Texas Idaho Maine Hawaii Nation Virginia Alaska Indiana Florida Arizona Oregon Kansas Georgia Nevada Missouri Michigan Vermont Alabama Louisiana Montana California Wyoming Maryland Arkansas Delaware Kentucky Wisconsin Colorado Tennessee Oklahoma Minnesota Nebraska Mississippi New York Washington Connecticut Pennsylvania New Jersey West Virginia Rhode Island New Mexico South Dakota North Dakota Massachusetts South Carolina North Carolina New Hampshire Educational Attainment – Percent of Adults 25 to 64 with a Bachelor’s Degree or Higher, 2004 Source: 2004 American Community Survey, Public Use Microdata Samples
Personal Income Per Capita ($), 2005 60,000 47,819 50,000 44,289 43,771 41,760 40,507 38,408 38,390 37,946 37,373 40,000 37,065 37,036 36,778 36,153 36,120 35,883 35,612 35,409 34,897 34,586 34,539 33,616 33,565 33,327 33,219 33,116 32,836 32,478 32,462 32,315 32,103 31,899 31,614 31,395 31,276 31,252 31,121 31,107 30,553 30,267 29,387 29,330 29,136 28,513 28,352 28,158 28,061 27,644 30,000 27,215 26,874 25,318 24,820 20,000 10,000 0 Nation Utah Ohio Illinois Idaho Texas Iowa Maine Hawaii Virginia Alaska Florida Indiana Arizona Oregon Kansas Georgia Nevada Missouri Vermont Michigan Alabama Louisiana Montana California Wyoming Maryland Arkansas Delaware Kentucky Wisconsin Colorado Minnesota Oklahoma Nebraska Tennessee Mississippi Washington New York Connecticut Pennsylvania New Jersey Massachusetts West Virginia Rhode Island New Mexico South Dakota North Dakota North Carolina South Carolina New Hampshire Source: Bureau of Economic Analysis, U.S. Census Bureau
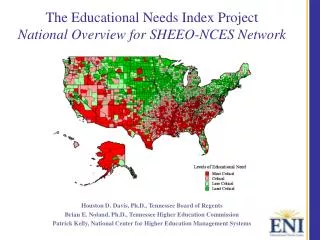
Education Factors - Percent of 18-64 Year Olds with a High School Diploma, 2000 Data Source: U.S. Census Bureau, 2000 Census
Economic Factors – Percent of the Population Age 64 and Under Living in Poverty, 1999 Data Source: U.S. Census Bureau, 2000 Census
Market Factors – Projected Percent Change in the Population Age 64 and Under, 2000-2020
Educational Needs Index Foundational Constructs • Education and the economy are increasingly intertwined as human capital becomes a centerpiece of the knowledge economy. • State budgets are increasingly challenged by fluctuating state revenues and focused expenditures are the new reality. • The demographic characteristics of the states are not uniform from region to region. The current use of only state-level indicators in the planning process limits the ability of planners to differentiate between the various regions of the nation. • Educational planning indicators need to be linked with economic and demographic variables to provide a more accurate representation of our citizens’ needs.
Educational Needs Index Key Questions • What is the current level of educational attainment of the state and its respective counties? • What is the current health of each state’s counties from an economic perspective? • Are there counties in the state that are quickly growing and have shifting demographics that skew toward youth, young adults, or at-risk minority populations? • What counties in the state can be identified by the ENI to be under-educated, facing economic challenges, and facing robust population growth and shifting demographics in categories of youth, young adults, or at-risk minority populations?
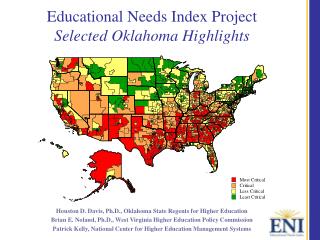
ENI – Education Factor by Quartile Source: Educational Needs Index, www.educationalneedsindex.com
ENI Education Factors OK 00800 = Adair, Cherokee, McIntosh, Muskogee, Okmulgee, Sequoyah OK 01000 = Rogers (part), Wagoner
ENI – Economic Factor by Quartile Source: Educational Needs Index, www.educationalneedsindex.com
ENI Economic Factors OK 00800 = Adair, Cherokee, McIntosh, Muskogee, Okmulgee, Sequoyah OK 01000 = Rogers (part), Wagoner
ENI – Population Factor by Quartile Source: Educational Needs Index, www.educationalneedsindex.com
ENI Population Factors OK 00800 = Adair, Cherokee, McIntosh, Muskogee, Okmulgee, Sequoyah OK 01000 = Rogers (part), Wagoner
ENI – Overall Index by Quartile Source: Educational Needs Index, www.educationalneedsindex.com
ENI Calculations for Oklahoma PUMS 00800 (Adair County - Cherokee County - McIntosh County - Muskogee County - Okmulgee County - Sequoyah County)
ENI Calculations for Oklahoma PUMS 01000 (Rogers County (part) – Wagoner County)
ENI Calculations for Oklahoma PUMS 00400 (Caddo County - Comanche County - Cotton County - Jefferson County - Stephens County - Tillman County)
ENI Calculations for Oklahoma PUMS 00600 (Creek County - Hughes County - Okfuskee County - Osage County (part) - Pawnee County - Payne County - Seminole County)
Educational Needs Index Urban and Rural Policy Audits Yakima Valley, WA Chicago Providence S. Virginia Central California NW New Mexico Memphis SE KY – NE TN Las Vegas AR-MS-LA El Paso Miami Rural Targets Urban Targets
Educational Needs IndexImproving the Policy Toolbox • Regional education organizations are using the ENI in their outreach and policy/planning discussions. • Project has aided several organizations in the development of grant proposals and building a case for need and importance of selected areas. • Institutional researchers have found the ENI to be helpful in strengthening the depth and scope of their environmental scanning activities. • Educational systems seeking the establishment of P-16 regional networks have employed the ENI in raising awareness of the growing importance of partnerships. • Various education, economic development, and advocacy groups have found the comparison data at local, regional, and state levels to be particularly useful in public presentations seeking to inform the public debate surrounding the relationship between education and the economy.
For additional information on the Educational Needs Index contact: Dr. Houston Davis, Oklahoma State Regents for Higher Educ. hdavis@osrhe.eduor 405/225-9175 Dr. Brian Noland, West Virginia Higher Education Policy Commission noland@hepc.wvnet.eduor 304/558-2101 Mr. Patrick Kelly, NCHEMS patrick@nchems.orgor 303/497-0307 For detailed information about ENI visit: http://www.educationalneedsindex.com