Download
1 / 35
350 likes | 531 Views
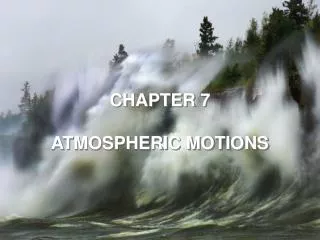
Atmospheric Motions. Science Concepts Potential Energy Coriolis Force. Circulation Scales Thermally Driven Winds Global Circulations Rainfall Versus Latitude Observed Global Circulation Three-celled Circulation Wind Patterns Pressure Patterns Rainfall Patterns

E N D
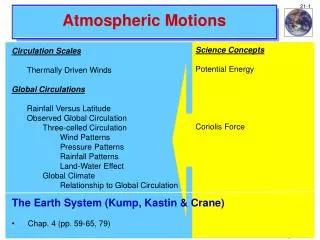
Atmospheric Motions Science Concepts Potential Energy Coriolis Force Circulation Scales Thermally Driven Winds Global Circulations Rainfall Versus Latitude Observed Global Circulation Three-celled Circulation Wind Patterns Pressure Patterns Rainfall Patterns Land-Water Effect Global Climate Relationship to Global Circulation The Earth System (Kump, Kastin & Crane) • Chap. 4 (pp. 59-65, 79)
Atmospheric Scales Object of Space Scale Time TerminologyStudyor SizeScale Macroscale Climate Global Years Seasons Hemisphere Weeks National Cyclonic Highs & Lows (5000 km) or Hurricanes Synoptic Regional Days Fronts (1000 km) Mesoscale Squalls Thunderstorms Local Hours Convective Showers (100 km) or Cumulus Tornadoes Terminal (10 km) Minutes Microscale Gusts Eddies Spot Seconds (1 meter)
Thermally Driven Wind Systems Examples • Global circulation • Midlatitude cyclones • Monsoons • Hurricanes • Land-sea breezes • Heat island circulations • Mountain-valley winds
Thermally Driven Wind Systems Science quotes of 5th and 6th graders - Clouds just keep circling the earth around and around. And around. There is not much else to do. Global Circulation http://visibleearth.nasa.gov/Sensors/Terra/
Thermally Driven Wind Systems Hurricanes • Hurricane Georges battering the Gulf Coast on September 28, 1998
Thermally Driven Wind Systems Hurricanes (Con’t) • Ocean cooling effects of hurricanes • Katrina and Rita, each cooled Gulf temperatures more than 4°C in areas, and the entire Gulf ~1°C • Hurricanes cool the ocean by > transferring heat to the atmosphere through evaporation > upwelling of cold water due to the suction effect of the storm’s low pressure > cold raindrops that remain on the ocean surface for a time > shielding the ocean surface from direct sunlight by cloud cover http://earthobservatory.nasa.gov/Newsroom/ NewImages/images.php3?img_id=17164
Thermally Driven Wind Systems Sea Breezes
Global Circulations Net Radiation vs Latitude 400 Radiation Received Radiation Lost 300 Surplus Radiation Intensity ( W / m 2 ) 200 Deficit Deficit 100 Heat Transfer Heat Transfer 90N 50N 30N 10N 0 10S 30S 50S 90S Latitude
Global Circulations What do you think the global distribution of precipitation should look like?
Global Circulations Global Rainfall • 1/00 to 4/06 precipitation in mm/day http://earthobservatory.nasa.gov/Observatory/Datasets/rainfall.gpcp.html
Global Circulations January Average Precipitation (mm/day) • ‘79 - ‘05 average January, July and Annual precipitation - Dashed lines are 0°, 30°, 60° north and south latitudes Annual July http://www.gewex.org/ GPCP_data_products_9-2006.pdf What latitude has the highest annual precipitation?
Global Circulations Rainfall vs Latitude Rainfall 2000 Evaporation 1500 1000 Millimeters per year Runoff 500 0 -500 90°N 60°N 30°N 0° 30°S 60°S 90°S Latitude
Global Circulations Inter- Tropical Convergence Zone
Global Circulations Annual Average Cloud Amount • 1983-2001 http://isccp.giss.nasa.gov/climanal2.html Zonal Mean Cloud Amount (%) Total Cloud Amount (%)
Global Circulations Simple One-Celled Circulation • Upward motion at the Equator • Downward motion at the poles • Equatorward motion at low levels • Poleward motion at upper levels of the troposphere http://rst.gsfc.nasa.gov/Sect14/Sect14_1c.html
Three-Celled Circulation Surface Winds• Polar Cell - Polar Easteries• Mid-latitude Cell - Highly variable - Storms move from west to east - Zone of Westerlies• Equatorial Cell - Northeast Tradewinds in the northern hemisphere - Southeast Tradewinds in the southern hemisphere Global Circulations http://rst.gsfc.nasa.gov/Sect14/Sect14_1c.html
Global Circulations Three-Celled Circulation • Polar Cells - Thermally direct - Downward motion at the Poles • Equatorial Cells - Thermally direct - Upward motion at the Equator • Mid-latitude cell - Thermally indirect - Downward motion at 30° - Equatorward motion at upper levels of the troposphere - Poleward motion at lower levels http://rst.gsfc.nasa.gov/Sect14/Sect14_1c.html
Global Circulations http://airs.jpl.nasa.gov/Data/FeaturedProducts/AIRS_T500.mov Three-Celled Circulation • Temperatures at 500 mb (about 5.5 km or 3.4 miles above sea level) • Total water vapor above 500 mb to the top of the atmosphere • Note Northern hemisphere mid-latitude systems move eastward • Note Northern hemisphere tropical systems move westward http://rst.gsfc.nasa.gov/Sect14/Sect14_1c.html
Global Circulations Three-Celled Circulation Surface WindsThe Nantucket whaleship Essex was sunk by an attacking whale just south of the Equator in the Pacific in 1820 and was the inspiration for the Melville’s Moby Dick.“Like a skier traversing the face of a mountian, a Nantucket whaleship took an indirect route toward Cape Horn, a course determined by the prevailing winds of the Atlantic Ocean. First, pushed by westerlies, the ship sailed south and east toward Europe and Africa. There she picked up winds called the northeast trades, which took her back across the ocean again, in the direction of South America. After crossing the equator in an often airless region known as the doldrums, she worked her way south and west through the southeast trades into an area of variable winds. Then she encountered the band of westerlies that could make rounding the Horn so difficult.” In the Heart of the Sea; The Tragedy of the Whaleship Essex - Nathaniel Philbrick (p. 37)
Global Circulations Northern Deserts Southern Deserts Science quotes of 5th and 6th graders - It is so hot in some places that the people there have to live in other places.
Global Circulations Can we have deserts in the ocean?
Global Circulations Ocean Deserts • Note higher values of salinity north and south of the Equator • Salinity reflects the total amount of dissolved solids in ocean water - PSU (practical salinity unit) describes the concentration of dissolved salts in water - 35 ppt means 35 lbs of salt per 1,000 lbs of seawater http://aquarius.gsfc.nasa.gov/overview-sss.html
Global Circulations Ocean Deserts (Con’t) • Ocean salinity is increased by evaporation and freezing of seawater and decreased by precipitation and melting of snow and ice http://aquarius.gsfc.nasa.gov/science-watercycle.html
Global Circulations Summary • Driven by differential or uneven heating between the poles and the equator • Three circulation cells in each hemisphere. In the Northern hemisphere - 0° to 30° - zone of “Northeast Trade Winds” - 30° to 60° - zone of “Prevailing Westerlies” - 60° to pole - zone of “Polar Easterlies" • Both the Polar Easterlies and the Northeast Trades are very consistent, while the Prevailing Westerlies are characterized by being variable and highly changeable • As part of the three-celled circulation pattern - 0° is characterized by upward motion - 30° is characterized by subsidence - 60° is characterized by upward motion - 90° is characterized by sinking motion
Global Circulations Summary (Con’t) • Three-celled circulation results in - 0° is wet with heavy precipitation - 30° is dry with more evaporation than rain - Zone of Prevailing Westerlies has more precipitation than evaporation - 90° is dry with little precipitation • This simple latitudinal pattern is modified by the land and water distributions - More in the Northern Hemisphere because there is more land in the Northern Hemisphere
Global Circulations January Mean Surface Pressure (mb)
Global Circulations July Mean Surface Pressure (mb)
Global Circulations • Semi-Permanent Pressure Systems • Ocean Strength Strength • LocationPositionin Winterin Summer • Aleutian low 60°- 65° Strong Weaker • Icelandic low 60°- 65° Strong Weaker • Hawaiian or 30°- 35° Weaker Stronger • Pacific high • Bermuda high 30°- 35° Weaker Stronger • Continental Strength Strength • Locationin Winterin Summer • Siberian high Strong Absent • North American high Strong Absent • SW U.S. thermal low Absent Strong • India thermal low Absent Strong
Atmospheric Motions Science Concepts Seasonal Effects Global Circulations (Con’t) Monsoons The Blue Planet (Skinner, Porter & Botkin) • Chap. 13 (p. 303) Science quotes of 5th and 6th graders - A monsoon is a French gentleman.
Monsoon Mumbai (Bombay) Monsoon 2005 Rainfall • Mumbai (formerly Bombay), India received a record-breaking 942 millimeters (37.1 inches) of rain in a 24-hour period on Tuesday, July 26, 2005 • India’s previous all-time single-day record (838 mm; 33 in) set in 1912 • Heavy monsoon rain triggered deadly floods, which have claimed more than 500 lives in the country’s western Maharashtra state, with 273 fatalities in Mumbai alone, as of July 28 • Monsoon-related flooding is not unusual in summer when heating landmass generates winds that pull warm, moisture-laden air over the Indian subcontinent http://earthobservatory.nasa.gov/Newsroom/ NewImages/images.php3?img_id=16985
Monsoon Jan 2003 Temperature (K) Jul 2003 Temperature (K) Science quotes of 5th and 6th graders - Isotherms and isobars are even more important than their names sound. Degrees Kelvin 263 273 283 293 303 http://airs.jpl.nasa.gov/ multimedia/products_suite/ products_suite_temp.html
Monsoon Jan Average Pressure (mb) Jul Average Pressure (mb)
Monsoon Monsoon Winds • Winter (top) winds offshore • Summer (bottom) winds onshore http://earthobservatory.nasa.gov/Study/Monsoon/monsoon4.html
Monsoon Jan Average Precip (mm/day) Jul Average Precip (mm/day)
Monsoon Tucson Average Daily Surface Dewpoint Temperature (°F) • 1998 - Start date July 3 • 2005 - Start date July 18 http://www.wrh.noaa.gov/images/twc/monsoon/1998monsoon.png http://www.wrh.noaa.gov/images/twc/monsoon/2005monsoon.png