Download
1 / 13
140 likes | 304 Views
CONAB – National Company For Food Supply UNICAMP – University of Campinas. Crop Monitoring. Andre Souza (CONAB) and Agmom Rocha (UNICAMP). Brazil: What reasons??.

E N D
CONAB – NationalCompany For FoodSupply UNICAMP – Universityof Campinas Crop Monitoring Andre Souza (CONAB) and Agmom Rocha (UNICAMP)
Brazil: What reasons?? Leading producer of world agricultural production which highlights the grain, sugarcane and coffee, among other crops and there is also the production of bio fuels. This was made possible by technologicaladvances that have provided this high ranking worldwide, and the influence of climate. Due to the country's continental dimensions, climate variability is a major challenge to maintain this position drives the adoption and new techniques, technologies and methodologies.
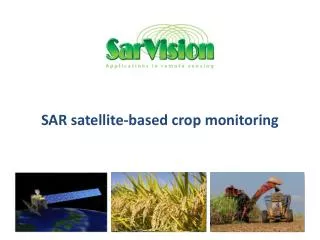
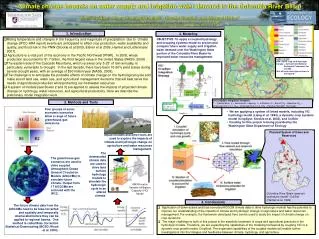
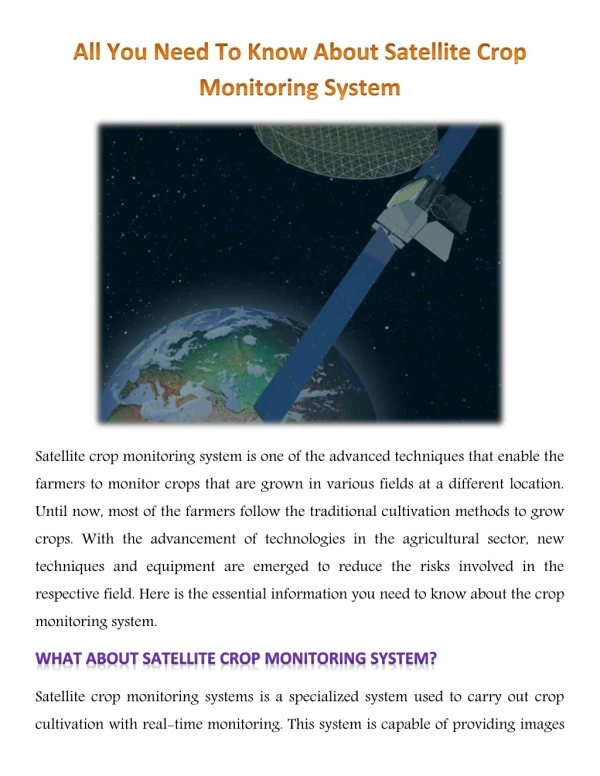
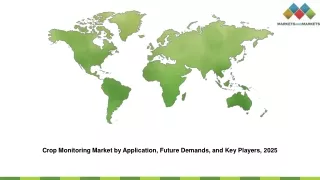
Objective of the application & region of interest Using vegetation indices derived from SPOT-VEGETATION satellite to monitoring and identify agricultural areas with temporary and permanent crops, also reforestation
Landscapesonvectors Sugarcane Grains Eucalyptos Coffee
Methodology NDVI DMP NDWI SPOT-VEGETATION DATA FVC = 1.1101*NDVI – 0.08577 • LAI = -2*ln(1-FVC) SSI = 3.173*NDVI – 0.297 COMBVI = DMP + 10*NDVI + 10*NDWI
Remote. Sensing Ok! Temperature Ok! METEO Radiation Snow LAI Phenology Crop Calendar Ok! Yield Crop Yield MODELS Next Step: Ok!
Obrigado!! Dank U!! Thankyou!!