Download
1 / 42
420 likes | 593 Views
Representation of Timbre in. the Auditory System. Shihab A. Shamma. Center for Auditory and Acoustic Research. Institute for Systems Research. Electrical and Computer Engineering. University of Maryland, College Park. A. t. t. r. i. b. u. t. e. s. o. f. C. o. m. p. l. e. x.

E N D
Representation of Timbre in the Auditory System Shihab A. Shamma Center for Auditory and Acoustic Research Institute for Systems Research Electrical and Computer Engineering University of Maryland, College Park
A t t r i b u t e s o f C o m p l e x S o u n d s A n a t o m y o f t h e A u d i t o r y Location Timbre Pitch S y s t e m C e n t r a l A u d i t o r y S t a g e s Spatial maps Computing pitch MGB IC C o l l i c u l a r S t a g e s N L L Harmonic templates ILD, ITD Spectral cues L L M i d b r a i n N u c l e i T B The auditory spectrum D C N P V C N E a r l y A u d i t o r y A V C N S t a g e s s o u n d
Auditory-Nerve Response Patterns to Two-Tone Stimulus average response 4000 2000 1000 500 250 60 Time( ms )
Auditory-Nerve Responses 4000 A CF (Hz) 250 4000 B CF (Hz) 250 Time (msec) 60 C 4 C CF (kHz) Harmonic series .25 500 Time (msec) Lateral Inhibition Estimated stimulus spectrum Cochlear Analysis A’ Sound B’ Characteristic Frequency Axis (CF) Auditory-nerve fibers Time (msec) 60 Basilar membrane vibrations C’ Hair cells along the tonotopic axis 500 Time (msec)
Down-Shift Normal Dilate Compress
/come/ /home/ /right/ /away/ Three envelopes of modulation: Slow (< 30 Hz) Intemediate (< 500 Hz) Fast (< 4 kHz)
2 0 0 0 1 0 0 0 5 0 0 2 5 0 1 2 5 1 0 2 0 0 3 0 0 4 0 0 5 0 0 6 0 7 0 8 0 9 0 0 1 0 0 0 0 0 0 0 T i m e ( m s ) w = 4 Hz ∆ A t ( ms ) 250 0 5 0 0.6 1 2 4 8 1 6 F r e q u e n c y ( k H z ) 0 Time (ms) 0.2 -12 -4 4 12 250 Rate (Hz) Frequency Decomposing a Spectrogram into Dynamic Ripples S
A W = 0.8 cyc/oct w(Hz) Time (ms) w= 12 Hz W (cyc/oct) B w W Time (ms) S T R F ( t , x ) | T F ( , ) | W X | F { } | frequency 0 -w w t ( m s ) T 0 0
Multiscale Cortical Representation of a Spectrogram Rate (Hz) Frequency
Scale-Rate Decomposition Reconstruction
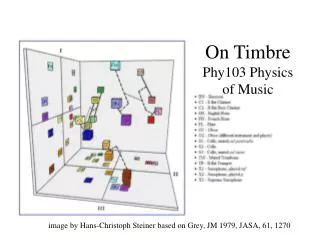
Timbre Metric for Musical Instruments Guitar Harp Violin Pizz. Violin Bowed Bass Synth A Synth B Oboe Clarinet Flute Horn Trumpet Guitar Harp Violin Pizz. Violin Bowed Bass Synth A Synth B Oboe Clarinet Flute Horn Trumpet Guitar Harp Violin Pizz. Violin Bowed Bass Synth A Synth B Oboe Clarinet Flute Horn Trumpet Guitar Harp Violin Pizz. Violin Bowed Bass Synth A Synth B Oboe Clarinet Flute Horn Trumpet Subjects (1-24) Spectral cues Temporal cues Spectro-temporal cues
Mapping musical instruments Guitar Trumpet A Melody with the Trumpar ACE Chord Trumpar
/come/ /home/ /right/ /away/ Three envelopes of modulation: Slow (< 30 Hz) Intemediate (< 500 Hz) Fast (< 4 kHz)
Human versus Ferret Sensitivity to Spectrotemporal Modulations
Relevance to Auditory Scene Analysis: Streaming and grouping Rate (Hz) Frequency Working Hypotheses Streaming: Any consistently isolated feature in the multiscale representation can be streamed e.g., spectral patterns (tones or average vocal tract spectra) repetitive temporal dynamics (modulatednoise or sinusoidal FM tones) - transients as segmenters Grouping: Harmonicity and its linearly interpolated extensions (pitch extraction and segregation, regular patterns) Shared dynamics (Common onsets and modulations)
4.0 2.0 1.0 0.5 250 500 1000 2000 4000 Cortical Representation of Harmonic & Shifted Spectra Multiscale Representation Auditory Spectrum Scale 16 14 12 Reduced Representation 10 8 6 4 2 0 0 20 40 60 80 100 120 140 Shifted Spectra are also grouped although they are inharmonic Scale Frequency
Morphing Voices
Acknowledgment Cortical Physiology and Auditory Computations Didier Depireux, Jonathan Fritz, David Klein Jonathan Simon Auditory Speech and Music Processing Tai Chi, Mounya El-Hilali, Powen Ru Supported by: MURI # N00014-97-1-0501 from the Office of Naval Research # NIDCD T32 DC00046-01 from the NIDCD # NSFD CD8803012 from the National Science Foundation