Understanding the Human Transcriptome: From RNA Types to Expression Analysis
This exploration into the human transcriptome covers essential RNA types, including ribosomal RNA (rRNA), transfer RNA (tRNA), and messenger RNA (mRNA), as well as other RNA forms like miRNA and siRNA. The transcriptome reflects gene expression dynamics influenced by environmental factors. Key technologies such as microarray and RNA-seq are compared to quantify gene transcripts effectively. Resources like Recount and Ensembl are highlighted for accessing RNA-seq datasets and gene expression patterns. This comprehensive study is crucial for advancements in functional genomics.

Understanding the Human Transcriptome: From RNA Types to Expression Analysis
E N D
Presentation Transcript
Exploring the Human Transcriptome Claudia Neuhauser University of Minnesota Informatics Institute
From DNA to Proteins Source: Wikipedia (http://en.wikipedia.org/wiki/Alternative_splicing)
RNA: Ribonucelic Acid • Types of RNA • Ribosomal RNA (rRNA): catalytic component of ribosomes (about 80-85%) • Transfer RNA (tRNA): transfers amino acids to polypeptide chain at the ribosomal site of protein synthesis (about 15%) • Messenger RNA (mRNA): carries information about a protein sequence to the ribosomes (about 5%) • Other types • miRNA, siRNA,snRNA, dsRNA,…
RNA: Ribonucelic Acid • Types of RNA • Ribosomal RNA (rRNA): catalytic component of ribosomes (about 80-85%) • Transfer RNA (tRNA): transfers amino acids to polypeptide chain at the ribosomal site of protein synthesis (about 15%) • Messenger RNA (mRNA): carries information about a protein sequence to the ribosomes (about 5%) • Other types • miRNA, siRNA,snRNA, dsRNA,…
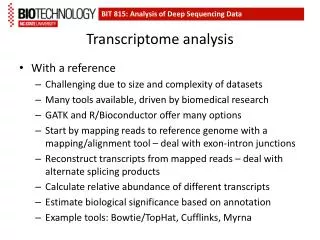
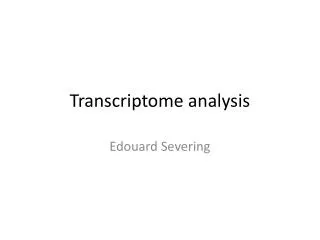
Transcriptome • The transcriptomeis the set of all RNA produced in a cell (or population of cells) • The transcriptome of a cell varies over time and with environmental conditions • The mRNA transcripts reflect which genes are actively expressed • Microarray technology • RNA-seq technology
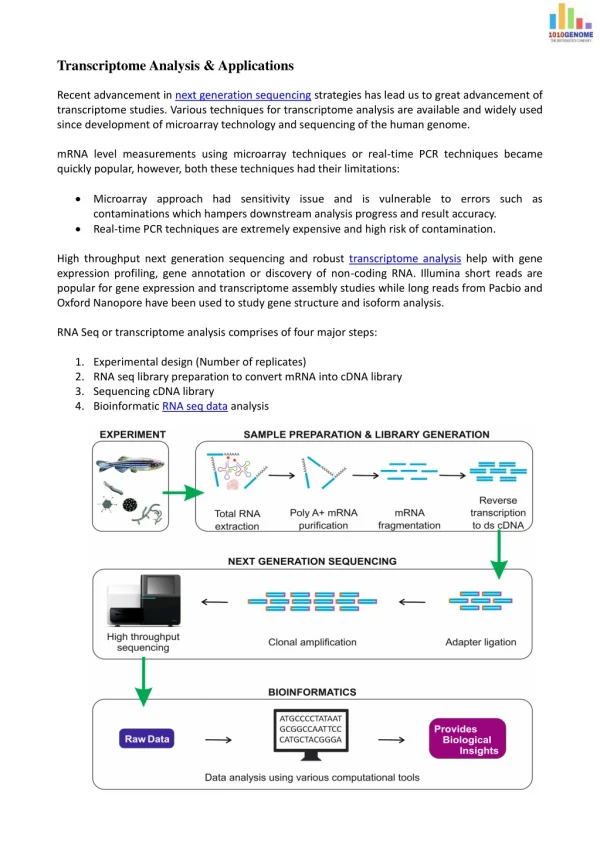
Exploring Transcriptomes Both microarray and RNA-seq compare mRNA and provide quantification of gene transcripts From: Functional Genomics (G. Meroni and F. Petrera. 2012. Accessed through INTECH (http://www.intechopen.com/books/functional-genomics/beyond-the-gene-list-exploring-transcriptomics-data-in-search-for-gene-function-trait-mechanisms-and)
Comparing Microarray and RNA-Seq Wang, Zhong, Mark Gerstein, and Michael Snyder. "RNA-Seq: a revolutionary tool for transcriptomics." Nature Reviews Genetics 10.1 (2009): 57-63.
RNA seq Experiment By Boraas (Own work) [Public domain], via Wikimedia Commons http://commons.wikimedia.org/wiki/File%3ARNA_Seq_Experiment.png
Malone, John H., and Brian Oliver. "Microarrays, deep sequencing and the true measure of the transcriptome." BMC biology 9.1 (2011): 34.
Figure 4: Correlation of gene expression based on RPKM by RNA-Seq and protein abundance by label-free method(A) MS1 based quantification by msInspect plotted against RPKM, log transformed. (B) Normalized MS2 spectral counts (NSAF)) plotted against RPKM, log transformed. Data for mouse mitochondrial genes in brainstem tissue. Protein abundance by msInspect is based on top 3 normalized peptide area intensities. Source: Ning, Kang, Damian Fermin, and Alexey I. Nesvizhskii. "Comparative analysis of different label-free mass spectrometry based protein abundance estimates and their correlation with RNA-Seq gene expression data." Journal of proteome research 11.4 (2012): 2261-2271.
Resources • Recount • http://bowtie-bio.sourceforge.net/recount/ • Online resource of RNA-seq gene count datasets from 18 different studies • Ensembl • http://www.ensembl.org/index.html • Genome database (automated gene annotation system) • RefSeq • http://www.ncbi.nlm.nih.gov/refseq/ • NCBI Reference Sequence Database (manually curated) • Expression Atlas • http://www.ebi.ac.uk/gxa/home • Information on gene expression patterns under different biological conditions
The Data • ReCount • http://bowtie-bio.sourceforge.net/recount/ • “ReCount is an online resource consisting of RNA-seq gene count datasets built using the raw data from 18 different studies. […] By taking care of several preprocessing steps and combining many datasets into one easily-accessible website, we make finding and analyzing RNA-seq data considerably more straightforward.”
From ReCount to Excel I • Wang, ET, et al. (2008): http://www.ncbi.nlm.nih.gov/pubmed?term=18978772 • Count tables can be accessed by clicking on the “link” • Ctrl-a • Ctrl-c • Open Excel • Click on Cell A1 • Ctrl-v
From ReCount to Excel II • Click on the Data tab in your spreadsheet and click on Text to Columns in the ribbon under Data Tools. The Convert to Columns Wizard will guide you through the next steps. • Your original data are separated by spaces. Click on Delimited to choose the original data type, and click Next. • Click Space in the Delimiters box. You should see how the data will be displayed in the data preview. If it looks correct, click Finish. • Save your file or use the ones uploaded to the site.
The Data Gene ID Reads Sample ID
Exercises 1 & 2: The Wang et al. Data • Open the Heart tab • Explore the genes • Pick a gene ID and search in your browser for the gene ID • Explore the gene on the Ensemble website • Explore the read count distribution • What percentage of genes are expressed? • What is the distribution of read counts? • Detailed instructions are in workbook
From Raw Counts to Interpretation • What affects the magnitude of the number of reads assigned to a specific gene? • Exon model • Expression level • Length of gene • Sequencing depth
Normalizing Raw Counts I • Raw Data • Similar number of reads but different lengths • To compare genes within a sample, divide raw count by length of gene
Normalizing Raw Counts II • Find the total number of reads N • For gene i, calculate • These numbers are very small • The median is around 4x10⁻¹⁰ • Multiply by 109=1,000,000,000 • This new quantity is called RPKM (or FPKM) • Reads per kilobase pair per million mapped reads
Normalizing Raw Counts III • Calculating RPKM • This quantity can be used for within sample analysis • Note: gene annotation and length come from an ‘exon model’
Exercise 3 • Heart Length tab • Calculate RPKM • Plot RPKM as a function of length • Find genes that are strongly expressed in the heart and go to the Expression Atlas to confirm • Detailed instructions are in workbook
Exercise 4 • The Heart-Liver tab has RNA-seq read counts for two tissue types, the heart and the liver. We will use this data set to learn about differential expression. • How many genes are expressed in both the heart and the liver, in one but not the other, and in neither tissue?
Normalizing Raw Counts IV • To compare across samples, we need to account for sequencing depth • For each sample, find the total number of reads • For gene iin sample k, calculate • Sum over all genes i in sample to obtain normalizing factor Λk
Normalizing Raw Counts V • For each gene i in sample k, divide λikby Λk • This quantity, called relative abundance, can be used to compare across samples
Exercise 5 • The Heart Liver Length tab has an additional column (Column C) with the length of each gene. We will compare relative importance of each gene. • Determine the total number of reads N for each tissue. • Calculate relative abundance for each tissue • Graph the cumulative distribution function of the relative abundance as a function of the number of genes. • Detailed instructions are in workbook
Exercise 6 • Calculate the log fold change • ‘=ABS(LOG(ratio,2))’ • Graph the log fold change as a function of relative abundance for each tissue type