Transcriptome Analysis Technology Overview
Explore various technologies like Illumina Beadarray, Affymetrix GeneChip, and Spotted Arrays for measuring gene expression levels through RNA abundance. Understand how microarrays are utilized in detecting differential gene expression and clustering genes in stem cells.

Transcriptome Analysis Technology Overview
E N D
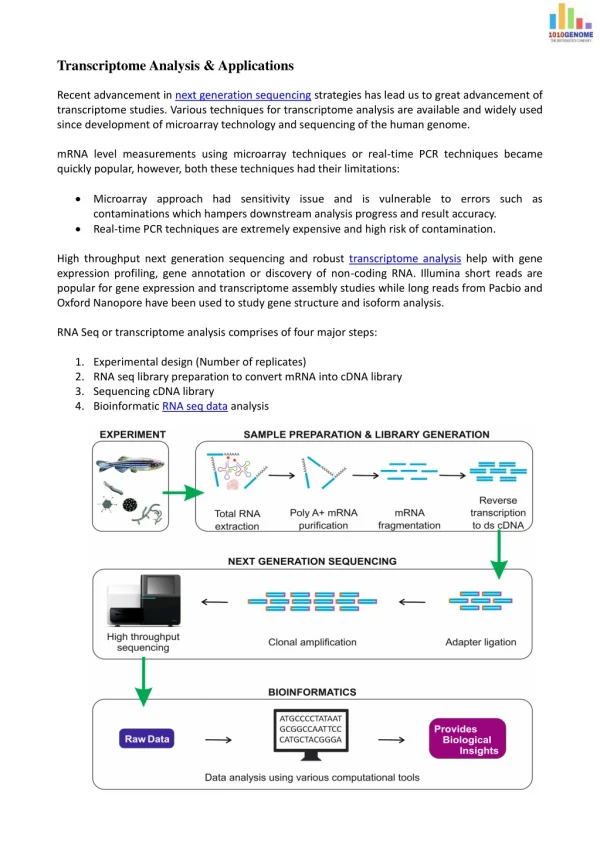
Presentation Transcript
Transcriptome Analysis Technology and Analysis overview Roy Williams PhD; Burnham Institute for Medical Research
Measuring Gene Expression Idea: measure the amount ofmRNAto see whichgenesare beingexpressedin (used by) the cell. Measuringproteinwould be more direct, but is currently harder.
General assumption of microarray technology • Use mRNA transcript abundance level as a measure of expression for the corresponding gene • Proportional to degree of gene expression
How to measure RNA abundance • Several different approaches with similar themes • Illumina bead array – highly redundant oligo array • Affymetrix GeneChip – highly redundant oligo array • Nimblegen – highly redundant oligo array • 2-colour array (very long cDNA; low redundancy) • SAGE (random sequencing of cDNA library)
The Illumina Beadarray Technology • Highly redundant ~50 copies of a bead • 60mer oligos • Absolute expression • Each array is deconvoluted using a colour coding tag system • Human, Mouse, Rat, Custom
Figure 1. Design of a randomly assembled gene-specific probe array x,y array coordinate Kenneth Kuhn et al. Genome Res. 2004; 14: 2347-2356
Affymetrix Technology • Highly redundant (~25 short oligos per gene) • Absolute expression • PM-MM oligo system valuable for cross hybe detection • Human, Mouse, E. coli, Yeast…….. • Affy and illumina arrays have been systematically compared
Spotted Arrays • Low redundancy • cDNA and oligo • Two dyes Cy5/Cy3 • Relative expression • Cost and custom
Corporate Cartoons • Measuring Gene Expression • http://www.affymetrix.com/corporate/outreach/lesson_plan/downloads/function.swf
Microarrays in action off on
Areas Being Studied with Microarrays • Differential gene expression between two (or more) sample types • Similar gene expression across treatments • Tumor sub-class identification using gene expression profiles • Classification of malignancies into known classes • Identification of “marker” genes that characterize different cell types • Identification of genes associated with clinical outcomes (e.g. survival)
Microarray experiments mRNA levels compared in many different contexts • Different tissues, same organism (brain vs liver) • See GNF Tissue Atlas • Same tissue, same organism (treated vs control, tumor vs non-tumor, undiff vs diff) • Same tissue, different organisms (wt v. ko) • Time course experiments (effect of ttt, development)
ChIP-on-chip hybridization Snap shot of transcription factors bound to locations in the Genome
Genome-wide data sets: considerations and complications Factors to consider when analysing genome-wide data sets • How were the data generated? • What method was used? Are there any technical limitations? • On how many repeats is the data set based? How reproducible are the data? • Has the error rate been estimated? If so, how high is it? • Can known and trusted examples be confirmed? • How complete is the data set? Which genes or proteins are missing? • How was the data analysed? • Do genes or proteins of interest also appear in other data sets? • Complications when comparing genome-wide data sets • Different isolates and experimental conditions have been used • Databases are not interconnected • There is no unifying data format (.GCT format is close…..) • Keywords for database searches are not standardized • Some data are not readily accessible or in the public domain
Microarrays and Stem Cells • Isolate and analyse as many different types of stem cells (and others) as possible • Discover structure/patterns in data • Classify/cluster genes according to their expression profile • Determine transcription circuitry
Aim: • Group together (cluster) genes that behave similarly across different conditions • Define/quantify similarities • There are dozens of similarity metrics • Euclidean distance • Pearson correlation • Standard correlation
Hierarchical Gene Clustering Genes 153 stem cell Samples
Cell Cycle Gene Cluster Guilt by Association!
K-means and NMF clustering • Classifies genes into non-overlapping groups • The number of clusters is specified by the user (k) • Unsupervised methods
K-means Clustering • INPUT
K-means Clustering • OUPUT: sorted into 16 groups
NMF clustering: current favourite Output is a correlation matrix Can see relationships between clusters Gives QC for output USED FOR: Cancer Classification Stem Cell Classification NMF is the most accurate classification technique: proven! Nested groups
Which types of genes are enriched in a cluster? Our Cell cycle • Idea: Compare your cluster of genes with lists of genes with common properties (function, expression, location). • Find how many genes overlap between your cluster and a gene list. • Calculate the probability of obtaining the overlap by chance This measures if the enrichment is significant. • This analysis provides an unbiased way of detecting connections between expression and function. 0 15000 25 7 GeneOntology Cell cycle
Demo of Ingenuity Pathway Analysis • Detects networks in your data • Allows you to look for connections between genes and drugs/small molecules • User friendly