Download
1 / 47
510 likes | 769 Views
Quantifying and Predicting Meat and Meat Products Quality Attributes using Electromagnetic Waves. Jean-Louis Damez, Sylvie Clerjon INRA, UR370 Qualité des Produits Animaux, F-63122 Saint Gènes Champanelle , France. 20 th August 2013. INTRODUCTION. Variability of raw material.

E N D
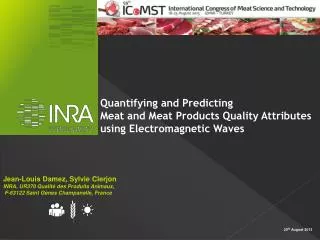
Quantifying and Predicting Meat and Meat Products Quality Attributes using Electromagnetic Waves Jean-Louis Damez, Sylvie Clerjon INRA, UR370 Qualité des Produits Animaux, F-63122 Saint Gènes Champanelle, France 20th August 2013
INTRODUCTION Variability of raw material • Lowprocess control High variability in product quality • Quality control • Qualitymeasurment • High-tech instruments • Simple probes • Certified product quality .02 Quantifying and predicting meat and meat products quality attributes using electromagnetic waves 20th August 2013
Methods for gaining access to meat characteristics .03 Quantifying and predicting meat and meat products quality attributes using electromagnetic waves Quantifying and predicting meat and meat products quality attributes using electromagnetic waves 20th August 2013
Methods for gaining access to meat characteristics .04 Quantifying and predicting meat and meat products quality attributes using electromagnetic waves Quantifying and predicting meat and meat products quality attributes using electromagnetic waves Damez & Clerjon (2012) Handbook of Meat and Meat Processing 20th August 2013
_02 Wave/matter interaction .05 .05 Quantifying and predicting meat and meat products quality attributes using electromagnetic waves Quantifying and predicting meat and meat products quality attributes using electromagnetic waves 20th August 2013
103 101 10-1 10-3 10-5 10-7 10-9 10-11 Lowfrequency 107 109 1011 1013 1015 1017 1019 1021 Radiowave Microwave Infrared UV X-Ray High frequency .06 .06 Quantifying and predicting meat and meat products quality attributes using electromagnetic waves Quantifying and predicting meat and meat products quality attributes using electromagnetic waves 20th August 2013
_03 ElectromagneticMethods .07 .07 Quantifying and predicting meat and meat products quality attributes using electromagnetic waves Quantifying and predicting meat and meat products quality attributes using electromagnetic waves 20th August 2013
Impedance NMR MRI Dielectrical Light reflection CT scanning Raman 103 101 10-1 10-3 10-5 10-7 10-9 10-11 Wavelengh (cm) Frequency (Hz) 107 109 1011 1013 1015 1017 1019 1021 Radiowave Microwave Infrared UV X-Ray High frequency Lowfrequency .08 Quantifying and predicting meat and meat products quality attributes using electromagnetic waves 20th August 2013
Impedance NMR MRI Dielectrical Light reflection CT scanning Raman 103 101 10-1 10-3 10-5 10-7 10-9 10-11 Wavelengh (cm) Frequency (Hz) 107 109 1011 1013 1015 1017 1019 1021 Radiowave Microwave Infrared UV X-Ray Lowfrequency High frequency .09 Quantifying and predicting meat and meat products quality attributes using electromagnetic waves 20th August 2013
Alternating current I Voltmeter V Electrodes Meat sample Impedancemeasurement Electrical impedance is the property of a material to resist electrical current flow. Transversal Longitudinal Direction of the electricalcurrent The principle of impedance measurement is to inject an alternative current and to measure the voltage at the electrodes. Impedance varies according to whether current is propagated along or across muscle fibres. .010 Quantifying and predicting meat and meat products quality attributes using electromagnetic waves 20th August 2013
Impedance decrease with frequency Impedancemeasurement .011 Quantifying and predicting meat and meat products quality attributes using electromagnetic waves 20th August 2013
Impedancemeasurement Impedance versus angle between electric current and meat fibers. Electrical anisotropy is a better predictor of muscle fibre strength than simple impedance. .012 Quantifying and predicting meat and meat products quality attributes using electromagnetic waves 20th August 2013
Impedancemeasurement Freshness PSE/DFD meat Meattenderness INRA TorryMeter (Distell .com) LF-STAR (Matthäus, Pöttmes, Germany) Added Water Intramuscular Fat Content Yang, et al. (2012) Madsen, et al. (1999) .013 Quantifying and predicting meat and meat products quality attributes using electromagnetic waves 20th August 2013
Impedance NMR MRI Dielectrical Lightreflection CTscanning Raman 103 101 10-1 10-3 10-5 10-7 10-9 10-11 Wavelengh (cm) Frequency (Hz) 107 109 1011 1013 1015 1017 1019 1021 Radiowave Microwave Infrared UV X-Ray High frequency Lowfrequency .014 Quantifying and predicting meat and meat products quality attributes using electromagnetic waves 20th August 2013
NMR / MRI Based on the emission and absorption of energy in the radiofrequency range of the electromagnetic spectrum Must contain odd numbers of protons or neutrons (i.e. 1H , 23Na, 31P or 1 3C …) NMR aligns magnetic moments with an applied constant magnetic field and disturbs this alignment using an orthogonal alternating radiofrequency magnetic field. .015 Quantifying and predicting meat and meat products quality attributes using electromagnetic waves 20th August 2013
NMR / MRI longitudinal relaxation time T1transversal relaxation time T2 time domain NMR spectroscopic NMR (signal versus frequency) NMR and meat science Renou, Bielicki, Bonny, Donnat, & Foucat (2003) Bertram & Andersen (2004) • 1H NMR to study water Bertram, (2004) Bertram & Andersen, (2007) Bertram, JianZhi, Rommereim, Wind, & Andersen, (2004) Straadt, Aaslyng, & Bertram, (2011) water content, WHC, water distribution, water mobility • 1H NMR for studying structure Water-protein interactions myofibrillar spacing and water mobility after heating Christensen, Bertram, Aaslyng, & Christensen, (2011) suitable technology for online measurement of meat tenderness ? Pearce, et al., (2011). • 31P NMR Changes of the various phosphorus metabolites. Overview Spyros & Dais (2009) significant effects of stunning method Bertram, Stodkilde-Jorgensen, Karlsson, & Andersen (2002) Monitor added phosphorous compounds understanding in WHC Johnsen, Jorgensen, Birkeland, Skipnes, & Skara, (2009) control polyphosphate additives in meat products Hrynczyszyn, Jastrzebska, & Szyk, (2010) • 23Na NMR and salt issues Classically performed to quantify salt content Foucat, Donnat, & Renou (2003) “free” and “bound” fraction optimizing , understanding industrial salting processes Erikson, Veliyulin, Singstad, & Aursand,(2004) Absolute quantification with multi quanta filtering Mouaddab, Foucat, Donnat, Renou, & Bonny,(2007) • NMR and fat issues Gives information on fat composition quantifying conjugated linoleic acids Maria, Colnago, Forato, & Bouchard, (2010) quantifying acid chain composition Siciliano, et al.,(2013) Stefanova, Vasilev, & Vassilev, (2011) .016 Quantifying and predicting meat and meat products quality attributes using electromagnetic waves 20th August 2013
Magnetic resonance imaging (MRI) NMR / MRI Mapping nuclei physical properties diffusion mobility binding state … • MRI and fat issues Contrasts between muscle and fat tissues Tingle, Pope, Baumgartner, & Sarafis, 1995 fish (Brix, Apablaza, Baker, Taxt, & Grüner, 2009; Toussaint, et al., 2005) meat Davenel, et al., (2012) Imaging the profile of oil uptake in fried meat Clerjon, et al., 2012 • MRI and salt issues (Aursand, Erikson, & Veliyulin, 2010; Aursand, et al., 2009; Erikson, et al., 2004; Gallart-Jornet, et al., 2007 Veliyulin & Aursand, 2007). sensitivity of 23Na is almost 10 times lower than 1H sensitivity Salt diffusion and distribution /structure observed by 1H NMR and optical microscopy /fat distribution using 1H MRI (Renou, Bonny, Foucat, & Traore, 2007; Veliyulin, Aursand, Erikson, & Balcom, 2009). Salt and water diffusion in meat during brine curing • porcine meat(Renou, Benderbous, Bielicki, Foucat, & Donnat, 1994; Vestergaard, Risum, & dler-Nissen, 2005) • bovine meat. Bertram, Holdsworth, Whittaker, & Andersen, (2005) .017 Quantifying and predicting meat and meat products quality attributes using electromagnetic waves 20th August 2013
Magnetic resonance imaging (MRI) NMR / MRI • MRI and muscle structure issues (Bonny, Laurent, & Renou, 2001; Laurent, Bonny, & Renou, 2000) susceptibility-weighted images (connective tissue) Diffusion Tensor Imaging (DTI) fiber organization in muscle (Basser, Mattiello, & Lebihan, 1994) intra voxel fiber orientation and distribution (Bonny & Renou, 2002) hindered and restricted diffusion in situ intra voxel structural information (fiber type and diameter) Damez, et al. (2012) • MRI and the viscoelastic properties track a mechanical wave (Manduca, et al., 2001). non destructive method ,viscoelastic properties locally (Gruwel, Latta, Matwiy, & Tomanek, 2010) • MRI and the cooking process monitor cooking under MRI (Shaarani, Nott, & Hall, 2006) deformation /temperature /muscle composition water expelling steps (Bouhrara, Lehallier, Clerjon, Damez, & Bonny, 2012) (Bouhrara, Clerjon, Damez, Kondjoyan, & Bonny, 2012) .018 Quantifying and predicting meat and meat products quality attributes using electromagnetic waves
NMR / MRI Both NMR and MRI remain expensive techniques, but they are increasingly used in food research applications. Although we are still far from introducing industrial NMR sensors on production lines, some new devices have appeared (Bruker, 2012) and are opening the way for time domain NMR experiments outside the laboratory (Capitani, Brilli, Mannina, Proietti, & Loreto, 2009). .019 Quantifying and predicting meat and meat products quality attributes using electromagnetic waves 20th August 2013
Impedance NMR MRI Dielectrical Light reflection CT scanning Raman 103 101 10-1 10-3 10-5 10-7 10-9 10-11 Wavelengh (cm) Frequency (Hz) 107 109 1011 1013 1015 1017 1019 1021 Radiowave Microwave Infrared UV X-Ray High frequency Lowfrequency .020 Quantifying and predicting meat and meat products quality attributes using electromagnetic waves 20th August 2013
Microwaves water state water content Dielectric properties molecular motion of polar molecules weak external alternating electric field Dielectric relaxation spectroscopy Frequency of the electric field relaxation frequency Dielectric properties change significantly around this relaxation frequency (Clerjon, Daudin, & Damez, 2003) .021 Quantifying and predicting meat and meat products quality attributes using electromagnetic waves 20th August 2013
Microwaves Water activity Clerjon et al. (2003) Water binding Water Holding Capacity PSE DFD Clerjon & Damez, (2009) Fraudulently added water in meat products (Kent and Anderson 1996; Kent et al. 2001) Shiinoki, Motouri, & Ito, (1998) Salt content Nelson, Bartley, & Lawrence, (1997) Parasites Damez & Clerjon, (2000) Foreign bodies .022 Quantifying and predicting meat and meat products quality attributes using electromagnetic waves 20th August 2013
Reflection Transmission-reflection (Nyfors, 2000) Meat aging • (Clerjon & Damez, 2005) Fish freshness. • (Clerjon & Damez, 2007) .023 Quantifying and predicting meat and meat products quality attributes using electromagnetic waves 20th August 2013
Coaxial Flesh quality (fish) (Mike, et al., 2007) Fresh meat quality parameters (Dreyß, Klaus, & Lücker, 2010) Salt and water content and water activity (Schimmer, Schönfeld, Duran Montgé, & Fulladosa, 2011) RFQSCAN STDR65 (Sequid GmbH, Bremen, Germany) Microstrip 2 GHz Fat content (MeatFatmeter Distell.com) .024 Quantifying and predicting meat and meat products quality attributes using electromagnetic waves 20th August 2013
Impedance NMR MRI Dielectrical Light reflection CT scanning Raman 103 101 10-1 10-3 10-5 10-7 10-9 10-11 Wavelengh (cm) Frequency (Hz) 107 109 1011 1013 1015 1017 1019 1021 Radiowave Microwave Infrared UV X-Ray Infrared High frequency Lowfrequency .025 Quantifying and predicting meat and meat products quality attributes using electromagnetic waves 20th August 2013
Infraredspectroscopy vibrational states absorb Chemical bonds emit vibrational states Reflectance and Transmittance mode Transmission is inappropriate for opaque solids (Rinnan, Berg, & Engelsen, 2009), Applications of near infrared spectroscopy in muscle food analysis possible implementation of in-line, on-line or at-line process monitoring (Weeranantanaphan, Downey, Allen, & Sun, 2011). .026 Quantifying and predicting meat and meat products quality attributes using electromagnetic waves 20th August 2013
IR Laboratory Fat in meat and fish products (Ziadi, Maldague, Saucier, Duchesne, and Gosselin (2012)) Detection of microbial spoilage freshness of fish (Nilsen, Esaiassen, Heia, & Sigernes, 2002) pork meat (Chen, Cai, Wan, & Zhao, 2011) chicken breast (Grau, et al., 2011) Water drip loss in pork samples (Geesink, et al., 2003) in smoked salmon (Huang, Cavinato, Mayes, Bledsoe, & Rasco, 2002) fermented sausages (Collell, Gou, Arnau, Muñoz, & Comaposada, 2012) Identification and authentication differentiation between breeds (del Moral, et al., 2009) authenticate meat muscle species (Cozzolino & Murray, 2004) frozen-thawed fish (Uddin, et al., 2005) detection of pork in beef meatballs (Rohman, Sismindari, Erwanto, & Che Man, 2011) metal pollutants in fish (Abdel-Gawad, Ibrahim, Ammar, & Ibrahim, 2012) .027 Quantifying and predicting meat and meat products quality attributes using electromagnetic waves 20th August 2013
IR Structural properties sarcomere length and collagen concentration Scattering coefficients of beef samples (Xia, Berg, Lee, & Yao, 2007) Myofiber diameter in brined pork (Bocker, Ofstad, Bertram, Egelandsdal, & Kohler, 2006) Structural information in fish (Isaksson, Swensen, Taylord, Fjaera, & Skjervold, 2001) • and meat (Liu, et al., 2003) Structural information in pork meat related to cold shortening and pH-related paleness (Swatland, 1995) .028 Quantifying and predicting meat and meat products quality attributes using electromagnetic waves 20th August 2013
IR Sample Chamber (3ml) Samplette i-LAB TA Hand HeldSpectrometerwww.microptixtech.com CORONA PLUS 45 NIR FT 20 Fantec Research Institute,Kosai, Japan Carl Zeiss MicroscopyGmbH www.zeiss.de/spectral .029 Quantifying and predicting meat and meat products quality attributes using electromagnetic waves 20th August 2013
IR • NIR hyperspectral imaging Fat in raw beef (Kobayashi, Mori, Nishino, Toyota, & Nakauchi, 2012) Identification and authentication of red meat species (Kamruzzaman, Barbin ,ElMasry, Sun & Allen 2012) Denaturation process during heating of myofibrillar and connective tissue (Kirschner, Ofstad, Skarpeid, Host, and Kohler 2004) in situ (Astruc, et al., 2012) .030 Quantifying and predicting meat and meat products quality attributes using electromagnetic waves 20th August 2013
IR on-line NIR system 760–1040 nm NIR region, estimation of water, fat and protein Drying processes / water content and distribution (Wold, et al., 2006) Fat content in batches of beef trimmings (Wold, et al., 2011) Moisture content of dehydrated prawns (380–1100 nm) (D. Wu, et al. 2012) Commercial NIR system Sorting of meat trimmings into categories (Måge, Wold, Bjerke, & Segtnan, 2013). (QV500, Tomra Sorting Solutions, Asker, Norway,) .031 Quantifying and predicting meat and meat products quality attributes using electromagnetic waves 20th August 2013
Impedance NMR MRI Dielectrical Lightreflection CT scanning Raman 103 101 10-1 10-3 10-5 10-7 10-9 10-11 Wavelengh (cm) Frequency (Hz) 107 109 1011 1013 1015 1017 1019 1021 Radiowave Microwave Infrared UV X-Ray High frequency Lowfrequency .032 Quantifying and predicting meat and meat products quality attributes using electromagnetic waves 20th August 2013
Raman Provides information about vibrational and rotational transitions in molecules Monochromatic light source Elasticscattering (RAYLEIGH) Inelasticscattering (RAMAN) Vibrational v=0(non exited) Stokes scattering v=1(excited) Anti-Stokes scattering Rotational Stokes and anti-Stokes similar .033 Quantifying and predicting meat and meat products quality attributes using electromagnetic waves 20th August 2013
Raman Predict fatty acid profiles in adipose tissue (Beattie et al. 2006, 2007) eating quality of beef silverside (Beattie et al. 2004) Degree of unsaturation and balance between amounts of SFA, MUFA, and PUFA (Baeten et al. 1998; Hourant, et al.2000) on pork meat (Olsen, Rukke, Flåtten, & Isaksson, 2007). Assess the quality of meat and fish(Herrero, 2008). Raman spectra / WSBF (Beattie et al. 2008) tenderness, juiciness , chewiness of fresh pork loins (Wang, Lonergan, & Yu, 2012) shear force and cooking loss in sheep meat (Schmidt, Scheier, & Hopkins, 2013). pork meat spoilage identification (Sowoidnich, Schmidt, Kronfeldt, & Schwagele, 2012) rapid assessment of meat spoilage (Argyri, et al., 2013) Effects of thermal treatment and salt addition (Herrero, Carmona, Lopez-Lopez, & Jimenez-Colmenero, 2008) .034 Quantifying and predicting meat and meat products quality attributes using electromagnetic waves 20th August 2013
TruScan, Ahura Scientific, Wilmington, MA, USA InPhototeTM InPhotonics, Inc., Norwood, MA, USA Thermo ScientificFirstDefender RM www.thermoscientific.com/ahura SafeInspec-0TM IdentiCheck PerkinElmer, Inc. BaySpec,Fremont, CA ,USA www.perkinelmer.com Raman Systems, NASA .035 Quantifying and predicting meat and meat products quality attributes using electromagnetic waves Technische Universitat Berlin, Hardenbergstr. Berlin, Germany 20th August 2013
UV-visible fluorescence v u Excitation u v Excited-State Lifetime w w Fluorescence Emission Emitted photon carries less energy therefore has a longer wavelength Several vibrational levels in the ground state different energies , thus frequencies determining the structure of the different vibrational levels Fluorescent molecules (fluorophores) Intrinsic fluorescent probe e.g. Tryptophan A smallselection of commonlyusedfluorophoresused to label for instance DNA (DAPI), cells (fluorescein & green fluorescent protein, GFP) and lipid membranes (perylene & DiI). .036 Quantifying and predicting meat and meat products quality attributes using electromagnetic waves 20th August 2013
UV-visible fluorescence Opaque samples Front face fluorescence Structural changes caused by meat processing polarized spectrometric measurements post mortem structural modifications (Clerjon, Peyrin, & Lepetit, 2011) cold shortening (Luc, Clerjon, Peyrin, & Lepetit, 2008) Quantification of connective tissue in ground beef (Wold, Lundby, & Egelandsdal, 1999). Texture of meat emulsions and frankfurters (Allais, Viaud, Pierre, & Dufour, 2004). Discriminate different bovine muscles (animal age, muscle type, chemical, mechanical properties) (Kulmyrzaev, et al. , 2012) .037 Quantifying and predicting meat and meat products quality attributes using electromagnetic waves 20th August 2013
UV-visible fluorescence Detection of microbial spoilage aromatic-amino-acids+nucleic-acids (excitation: 250 nm, emission: 280–480 nm) tryptophan residues of proteins (excitation: 290 nm, emission: 305–400 nm) NADPH (excitation: 336 nm, emission: 360–600 nm) discrimination between fresh and aged fish fillets (Dufour, Francia, & Kane, 2003). on pork meat (Oto, et al., 2013) using a portable measurement system on fish (Wu, Hsiao, Chu, Hu, & Chen, 2012) Determination of lipid oxidation lipid oxidation index in chicken breast distinguish between rancid and fresh meat (Wold & Mielnik, 2000) (Gatellier et al. 2007) in minced poultry meat Determination of the heterocyclic aromatic amines (HAA) in grilled meat (Sahar, Portanguen, Kondjoyan, & Dufour, 2010) .038 Quantifying and predicting meat and meat products quality attributes using electromagnetic waves 20th August 2013
UV-visible fluorescence Miniaturized hardware concepts for carrying out fluorescence and Raman spectroscopic measurements using a compact and light handheld device Concepts for the use and integration of such a device in the logistic chain (Jordan, et al., 2009) Miniaturizing fluorescence devices for on-line measurements (Aït-Kaddour, Boubellouta, & Chevallier, 2011) Portable commercial sensor, FLUO SENS Integrated (ESE, GmbH) www.ese-gmbh.de .039 Quantifying and predicting meat and meat products quality attributes using electromagnetic waves 20th August 2013
Impedance NMR MRI Dielectrical Light reflection CT scanning Raman 103 101 10-1 10-3 10-5 10-7 10-9 10-11 Wavelengh (cm) Frequency (Hz) 107 109 1011 1013 1015 1017 1019 1021 Radiowave Microwave Infrared UV X-Ray Lowfrequency High frequency .040 Quantifying and predicting meat and meat products quality attributes using electromagnetic waves 20th August 2013
X-Ray • Transmitted(A) A • Absorbed (B) B C • Scattered (C,D) D The ratio depends on samplethickness, density and composition, X-Ray energy. Anyl Ray Fat Analyser (Kartridg Pak Co., Davenport, IA, U.S.A.) .041 Quantifying and predicting meat and meat products quality attributes using electromagnetic waves 20th August 2013
X-Ray X-ray Computer Tomography (CT) analyze entire hams Håseth, Sørheim, Høy, & Egelandsdal, (2012) Santos-Garcés, Muñoz, Gou, Sala, & Fulladosa, (2012) assessing salt diffusion during ham salting Picouet, Gou, Fulladosa, Santos-Garcés, and Arnau (2013) X-ray micro-computed tomography (µCT) detailed internal structures , 3-D models X-ray phase-contrast tomography fatty acid composition density in meat-fraction ID19 beamline at the European Synchrotron Radiation Facility (ESRF) in Grenoble, France Jensen, et al., (2011) set-up using a conventional X-ray tube Donath, et al., (2010) .042 Quantifying and predicting meat and meat products quality attributes using electromagnetic waves 20th August 2013
X-Ray Dual-energy X-ray absorptiometry (DXA) • Couple two absorption measurements, • low X-ray energies (e.g., 62 keV) fat content and sample density dependent • higher energies (e.g., 120 keV) density dependent Reliable information mass and percentage of lean tissue and fat in sheep (Hunter, et al., 2011; Pearce, et al., 2009) in pig (Kremer, Fernandez-Figares, Foerster, & Scholz, 2012; Marcoux, Faucitano, & Pomar, 2005) bone mineral content and bone mineral density (Kremer, et al., 2012; Ryan, Lynch, & O' Doherty, 2011) .043 Quantifying and predicting meat and meat products quality attributes using electromagnetic waves 20th August 2013
X-Ray On-line DXA system fat content at production speed (up to 22 tons/hour) also detect foreign bodies MeatMaster by FOSS A/S (Hillerød, Denmark) Beef and pork trim analysis fat/lean ratio bone detection batch control SensorX by Marelhf, Iceland DXA only gives information about carcass composition and tissue content, coupling it with a non destructive imaging technique like MRI seems very promising (Kremer, et al., 2012). .044 Quantifying and predicting meat and meat products quality attributes using electromagnetic waves 20th August 2013
Conclusion Among the techniques overviewed, there is always an answer for each of the numerous quality issues in meat science. Qualify meat quality: few sensors and even fewer instruments have made the transition out of the lab. In meat technology : fast success in research but fail in practice overestimation of the selectivity underestimating the uncertainties harsh environment of a meat-processing plant Research efforts need to push harder in order to take the huge potential of current lab-based analysis techniques and transfer this technology to industry practice. .045 Quantifying and predicting meat and meat products quality attributes using electromagnetic waves 20th August 2013
Welcome to France 61stICoMST Thanks for your attention .046 Quantifying and predicting meat and meat products quality attributes using electromagnetic waves 20th August 2013
(adaptedfrom Castro-Giraldez et al. 2010) .047 Quantifying and predicting meat and meat products quality attributes using electromagnetic waves Quantifying and predicting meat and meat products quality attributes using electromagnetic waves 20th August 2013