Download
1 / 19
200 likes | 1.33k Views
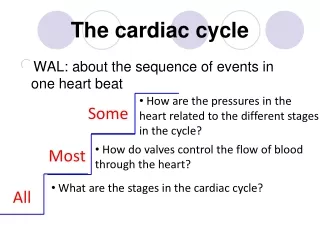
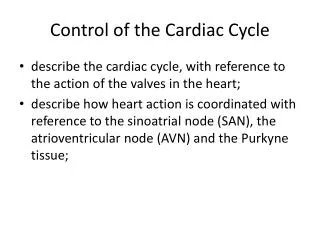
Control of the Cardiac Cycle. describe the cardiac cycle, with reference to the action of the valves in the heart; describe how heart action is coordinated with reference to the sinoatrial node (SAN), the atrioventricular node (AVN) and the Purkyne tissue;. Control of the Cardiac Cycle.

E N D
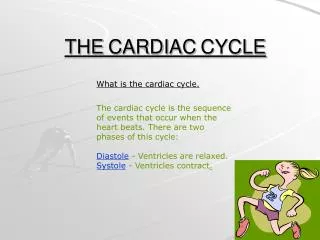
Control of the Cardiac Cycle • describe the cardiac cycle, with reference to the action of the valves in the heart; • describe how heart action is coordinated with reference to the sinoatrial node (SAN), the atrioventricular node (AVN) and the Purkyne tissue;
Control of the Cardiac Cycle • describe the cardiac cycle, with reference to the action of the valves in the heart; • describe how heart action is coordinated with reference to the sinoatrial node (SAN), the atrioventricular node (AVN) and the Purkyne tissue;
The Need for Co-ordination • Heart (cardiac) muscle is unusual as it can initiate it’s own contraction • This is known as myogenic • The muscles can contract and relax rythmically even if it’s not connected to the body • The muscles of the atria and ventricles have their own natural frequency of contraction- the atrial muscle has a higher frequency (number of contractions) than the ventricular muscle • The property of the muscle could cause inefficient pumping (fibrillation) if the contractions are not synchronised- so the heart needs a mechanism for control
The Need for Co-ordination • At the top of the right atrium, near the point where the vena cava empties blood into the atrium, is the sino-atrial node (SAN) also known as the pacemaker • This is a small patch of tissue that generates electrical activity • The SAN initiates an excitation wave about 55-80 times a minute Use p70 to summarise the role of the SAN and AVN
Contraction of the Atria • The wave of excitation quickly spreads over the walls of both atria • It travels along the membranes of the muscle tissue and causes the cardiac muscles to contract • This is Atrial Systole
Contraction of the Atria • At the base of the atria is a disc of tissue that cannot conduct the excitation wave (electrical wave) • This means the wave cannot spread directly to the ventricles • At the top of the inter ventricular septum (separating the two ventricles) is another node- the atrio-ventricular node (or AVN) position 2 on the diagram • This is the only route through the disc of non-conducting tissue • The wave of excitation is delayed in the node, this allows time for the atria to finish contracting and for the blood to flow down into the ventricles before they contract 1 = SAN (pacemaker) 2 = AVN
Contraction of the Ventricles • After the delay the wave of excitation is carried away from the AVN and down specialised conducting tissue called the Purkyne tissue which runs down the inter ventricular septum (position 3 on diagram) • At the base of the septum the excitation wave spreads out over the walls of the ventricles • As it spreads upwards from the base of the ventricles, it causes the muscles to contract • This means that that ventricles contract from the base upwards, pushing blood up to the major arteries – the aorta and the pulmonary artery 3 = Bundle of His 4 & 5 = Purkyne Tissue
ElectroCardiograms • We can monitor the electrical activity of the heart using an electrocardiogram or ECG • Sensors must be attached to the skin which pick up the electrical signals from the heart • The trace of a healthy person has a particular shape consisting of waves labelled P, Q, R, S and T • P shows the excitation of the atria • QRS indicates excitation of the ventricles • T shows diastole (relaxing)
The Shape of an ECG • The shape of the ECG trace can sometimes be used to show which part of the heart is unhealthy • It can show irregular heart beat (arrhythmia) if it is in fibrillation (the beat is not co-ordinated), if it has suffered a heart attack (myocardial infarction) • It can also indicate if the heart is enlarged or if the Purkyne system is not conducting electrical activity properly A heart block is when there is a problem with the electrical signals in the heart
20 boxes In 1 second, 25 boxes travel past the machine One box travels at 1 second/25 boxes = 0.04 seconds per box One heart beat lasts for approximately 20 boxes 20 boxes x 0.04 seconds per box = 0.8 seconds for each heart beat How many 0.8 seconds are in 1 minute? 60 seconds / 0.8 seconds = 75 beats per minute
b (i) This is the time during which the ventricles are contracting B (ii) In 1 second, 25 boxes travel past the machine One box travels at 1 second/25 boxes = 0.04 seconds per box Contraction time (Q-T) lasts for approximately 7 boxes 7 boxes x 0.04 seconds per box = 0.28 seconds for each contraction time
b (i) This is the time during which the ventricles are relaxed and filling with blood B (ii) In 1 second, 25 boxes travel past the machine One box travels at 1 second/25 boxes = 0.04 seconds per box Contraction time (T-Q) lasts for approximately 13 boxes 13 boxes x 0.04 seconds per box = 0.52 seconds for each filling time