Understanding Financial Ratio Analysis: A Comprehensive Guide
Learn about the significance of ratio analysis in financial appraisal, risk assessment, and decision-making for businesses. Discover key ratios and their implications with practical examples and comparisons.


Understanding Financial Ratio Analysis: A Comprehensive Guide
E N D
Presentation Transcript
RATIO ANALYSIS Ratio-analysis is a concept or technique which is as old as accounting concept. Financial analysis is a scientific tool. It has assumed important role as a tool for appraising the real worth of an enterprise, its performance during a period of time and its pit falls. Financial analysis is a vital apparatus for the interpretation of financial statements. It also helps to find out any cross-sectional and time series linkages between various ratios.
RATIO ANALYSIS Unlike in the past when security was considered to be sufficient consideration for banks and financial institutions to grant loans and advances, nowadays the entire lending is need-based and the emphasis is on the financial viability of a proposal and not only on security alone. Further all business decision contains an element of risk. The risk is more in the case of decisions relating to credits. Ratio analysis and other quantitative techniques facilitate assessment of this risk.
RATIO ANALYSIS Ratio-analysis means the process of computing, determining and presenting the relationship of related items and groups of items of the financial statements. They provide in a summarized and concise form of fairly good idea about the financial position of a unit. They are important tools for financial analysis.
WHY FINANCIAL ANALYSIS Lenders’ need it for carrying out the following • Technical Appraisal • Commercial Appraisal • Financial Appraisal • Economic Appraisal • Management Appraisal
Ratio Analysis It’s a tool which enables the banker or lender to arrive at the following factors : • Liquidity position • Profitability • Solvency • Financial Stability • Quality of the Management • Safety & Security of the loans & advances to be or already been provided
Before looking at the ratios there are a number of cautionary points concerning their use that need to be identified : • The dates and duration of the financial statements being compared should be the same. If not, the effects of seasonality may cause erroneous conclusions to be drawn. • The accounts to be compared should have been prepared on the same bases. Different treatment of stocks or depreciations or asset valuations will distort the results. • In order to judge the overall performance of the firm a group of ratios, as opposed to just one or two should be used. In order to identify trends at least three years of ratios are normally required.
The utility of ratio analysis will get further enhanced if following comparison is possible. • Between the borrower and its competitor • Between the borrower and the best enterprise in the industry • Between the borrower and the average performance in the industry • Between the borrower and the global average
How a Ratio is expressed? • As Percentage - such as 25% or 50% . For example if net profit is Rs.25,000/- and the sales is Rs.1,00,000/- then the net profit can be said to be 25% of the sales. • As Proportion - The above figures may be expressed in terms of the relationship between net profit to sales as 1 : 4. • As Pure Number /Times - The same can also be expressed in an alternatively way such as the sale is 4 times of the net profit or profit is 1/4th of the sales.
Some important notes • Liabilities have Credit balance and Assets have Debit balance • Current Liabilities are those which have either become due for payment or shall fall due for payment within 12 months from the date of Balance Sheet • Current Assets are those which undergo change in their shape/form within 12 months. These are also called Working Capital or Gross Working Capital • Net Worth & Long Term Liabilities are also called Long Term Sources of Funds • Current Liabilities are known as Short Term Sources of Funds • Long Term Liabilities & Short Term Liabilities are also called Outside Liabilities • Current Assets are Short Term Use of Funds
Some important notes • Assets other than Current Assets are Long Term Use of Funds • Installments of Term Loan Payable in 12 months are to be taken as Current Liability only for Calculation of Current Ratio & Quick Ratio. • If there is profit it shall become part of Net Worth under the head Reserves and if there islossit will become part of Intangible Assets • Investments in Govt. Securities to be treated current only if these are marketable and due. Investments in other securities are to be treated Current if they are quoted. Investments in allied/associate/sister units or firms to be treated as Non-current. • Bonus Shares as issued by capitalization of General reserves and as such do not affect the Net Worth. With Rights Issue, change takes place in Net Worth and Current Ratio.
LIQUIDITY RATIOS Indicate the short term solvency of the firm, i.e. the attitude of covering day by day current obligations through an efficient usage of current assets. Current Ratio : It is the relationship between the current assets and current liabilities of a concern. Current Ratio = Current Assets/Current Liabilities If the Current Assets and Current Liabilities of a concern are Rs.4,00,000 and Rs.2,00,000 respectively, then the Current Ratio will be : Rs.4,00,000/Rs.2,00,000 = 2 : 1 The ideal Current Ratio preferred by Banks is 1.33 : 1 Net Working Capital : This is worked out as surplus of Long Term Sources over Long Tern Uses, alternatively it is the difference of Current Assets and Current Liabilities. NWC = Current Assets – Current Liabilities
Current Assets : Raw Material, Stores, Spares, Work-in Progress. Finished Goods, Debtors, Bills Receivables, Cash. • Current Liabilities : Sundry Creditors, Installments of Term Loan, DPG etc. payable within one year and other liabilities payable within one year. • This ratio must be at least 1.33 : 1 to ensure minimum margin of 25% of current assets as margin from long term sources. • Current Ratio measures short term liquidity of the concern and its ability to meet its short term obligations within a time span of a year. • It shows the liquidity position of the enterprise and its ability to meet current obligations in time. • Higher ratio may be good from the point of view of creditors. In the long run very high current ratio may affect profitability ( e.g. high inventory carrying cost) • Shows the liquidity at a particular point of time. The position can change immediately after that date. So trend of the current ratio over the years to be analyzed. • Current Ratio is to be studied with the changes of NWC. It is also necessary to look at this ratio along with the Debt-Equity ratio.
STOCK/INVENTORY TURNOVER RATIO : (Average Inventory/Sales) x 365 for days (Average Inventory/Sales) x 52 for weeks (Average Inventory/Sales) x 12 for months Average Inventory or Stocks = (Opening Stock + Closing Stock) ----------------------------------------- 2 This ratio indicates the number of times the inventory is rotated during the relevant accounting period
DEBTORS TURNOVER RATIO : This is also called Debtors Velocity or Average Collection Period or Period of Credit given . (Average Debtors/Sales ) x 365 for days (52 for weeks & 12 for months) CREDITORS TURNOVER RATIO : This is also called Creditors Velocity Ratio, which determines the creditor payment period. (Average Creditors/Purchases)x365 for days (52 for weeks & 12 for months)
ACID TEST or QUICK RATIO : It is the ratio between Quick Current Assets and Current Liabilities. It should be at least equal to 1. Quick Current Assets : cash + cash equivalents Acid Test or Quick Ratio = Quick Current Assets/Current Liabilities Example : Cash 50,000 Debtors 1,00,000 Inventories 1,50,000 Current Liabilities 1,00,000 Total Current Assets 3,00,000 Current Ratio = > 3,00,000/1,00,000 = 3 : 1 Quick Ratio = > 1,50,000/1,00,000 = 1.5 : 1
STRUCTURE AND SOLIDITY RATIOS DEBT EQUITY RATIO : It is the relationship between borrower’s fund (Debt) and Owner’s Capital (Equity). Long Term Outside Liabilities / Tangible Net Worth Liabilities of Long Term Nature Total of Capital and Reserves & Surplus Less Intangible Assets For instance, if the Firm is having the following : Capital = € 200 Free Reserves & Surplus = € 300 Long Term Loans/Liabilities = € 800 Debt Equity Ratio will be => 800/500 i.e. 1.6 : 1
PROPRIETARY RATIO (≈ INVESTMENT/SHAREHOLDER RATIO) Indicates the extent to which Tangible Assets are financed by Owner’s Fund. Proprietary Ratio = (Tangible Net Worth/Total Tangible Assets) x 100 The ratio will be 100% when there is no Borrowing for purchasing of Assets. Earnings per share– profit after tax / number of shares Price earnings ratio– market price / earnings per share – the higher the better generally. Comparison with other firms helps to identify value placed on the market of the business.
OPERATING PROFIT RATIO (ROS1): It is expressed as => (Operating Profit / Net Sales ) x 100 Higher the ratio indicates operational efficiency NET PROFIT RATIO (ROS2): It is expressed as => ( Net Profit / Net Sales ) x 100 It measures overall profitability.
ASSET TURNOVER RATIO : Net Sales/Tangible Assets FIXED ASSET TURNOVER RATIO : Net Sales /Fixed Assets CURRENT ASSET TURNOVER RATIO : Net Sales / Current Assets GEARING RATIO: (Long Term Loans / Capital Employed) x 100 The higher the ratio the more the business is exposed to interest rate fluctuations and to having to pay back interest and loans before being able to re-invest earnings
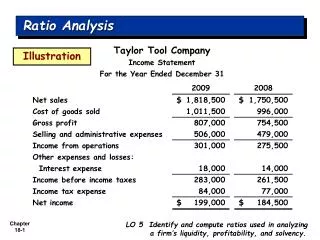
PROFITABILITY measures look at how much profit the firm generates from sales or from its capital assets (composite ratios) • Different measures of profit – gross and net • Gross profit– effectively total revenue (turnover) – variable costs (cost of sales) • Net Profit– effectively total revenue (turnover) – variable costs and fixed costs (overheads) GROSS PROFIT RATIO : By comparing Gross Profit percentage to Net Sales we can arrive at the Gross Profit Ratio which indicates the manufacturing efficiency as well as the pricing policy of the concern. Gross Profit Ratio = (Gross Profit / Net Sales ) x 100 Alternatively , since Gross Profit is equal to Sales minus Cost of Goods Sold, it can also be interpreted as below: Gross Profit Ratio = [ (Sales – Cost of goods sold)/ Net Sales] x 100 A higher Gross Profit Ratio indicates efficiency in production of the unit.
RETURN ON EQUITY CAPITAL (ROE) : • Net Profit after Taxes / Equity • RETURN ON CAPITAL EMPLOYED (ROCE) • Net Profit after Taxes / Average Capital Employed • Average Capital Employed is the average of the equity share capital and long term funds provided by the owners and the creditors of the firm at the beginning and end of the accounting period. • Evaluation of the overall profitability of the business and opinion about the convenience of the investment to the shareholder
EARNING PER SHARE : EPS indicates the quantum of net profit of the year that would be ranking for dividend for each share of the company being held by the equity share holders. Net profit after Taxes and Preference Dividend/ No. of Equity Shares PRICE EARNING RATIO : PE Ratio indicates the number of times the Earning Per Share is covered by its market price. Market Price Per Equity Share/Earning Per Share DIVIDEND YIELD– ordinary share dividend / market price x 100 – higher the better. Relates the return on the investment to the share price.
RETURN ON ASSETS : • Net Profit after Taxes/Total Assets • RETURN ON INVESTMENTS: : • Operating Profit /Operating Assets • Operating profit is Net Profit before Interests & Taxes and before extraordinary items (=EBITnorm) • Operating Assets are all assets employed in the core business (i.e. Investments) • Evaluation of the sole profitability of the core business. • ROI = Operating Profit/Sales * Sales/Operating Assets
LEVERAGE EFFECT • ROE = ROI + (ROI – i)(Liabilities/Net Worth) • Investing in the core business is convenient until the cost of borrowing money (i) becomes higher than ROI • If i ≤ ROI borrowing money is convenient up to infinite ROE ROI – i ROI L/NW