Ratio Analysis
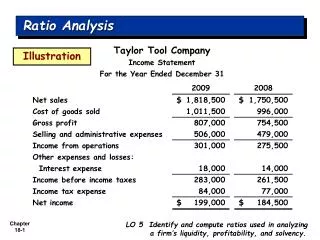
Ratio Analysis. Illustration. LO 5 Identify and compute ratios used in analyzing a firm’s liquidity, profitability, and solvency. Ratio Analysis. LO 5 Identify and compute ratios used in analyzing a firm’s liquidity, profitability, and solvency. Ratio Analysis.

Ratio Analysis
E N D
Presentation Transcript
Ratio Analysis Illustration LO 5 Identify and compute ratios used in analyzing a firm’s liquidity, profitability, and solvency.
Ratio Analysis LO 5 Identify and compute ratios used in analyzing a firm’s liquidity, profitability, and solvency.
Ratio Analysis All sales were on account. The allowance for doubtful accounts was $3,200 on December 31, 2009, and $3,000 on December 31, 2008. LO 5 Identify and compute ratios used in analyzing a firm’s liquidity, profitability, and solvency.
Liquidity Ratios Ratio Analysis Compute the Current Ratio for 2009. Current Assets = Current Ratio Current Liabilities $369,900 = 1.82 : 1 $203,500 The ratio of 1.82:1 means that for every dollar of current liabilities, the company has $1.82 of current assets. LO 5 Identify and compute ratios used in analyzing a firm’s liquidity, profitability, and solvency.
Liquidity Ratios Ratio Analysis Compute the Acid-Test Ratio for 2009. Cash + Short-Term Investments + Receivables (Net) Acid-Test Ratio = Current Liabilities $60,100 + $69,000 + $107,800 = 1.16 : 1 $203,500 The acid-test ratio measures immediate liquidity. LO 5 Identify and compute ratios used in analyzing a firm’s liquidity, profitability, and solvency.
Liquidity Ratios Ratio Analysis Compute the Receivables Turnoverratio for 2009. Net Credit Sales Receivables Turnover = Average Net Receivables $1,818,500 = 17.3 times ($107,800 + $102,800) / 2 It measures the number of times, on average, the company collects receivables during the period. LO 5 Identify and compute ratios used in analyzing a firm’s liquidity, profitability, and solvency.
Liquidity Ratios Ratio Analysis Receivables Turnover $1,818,500 = 17.3 times ($107,800 + $102,800) / 2 A variant of the receivables turnover ratio is to convert it to an average collection periodin terms of days. 365 days / 17.3 times = every 21.1 days This means that receivables are collected on average every 21 days. LO 5 Identify and compute ratios used in analyzing a firm’s liquidity, profitability, and solvency.
Liquidity Ratios Ratio Analysis Compute the Inventory Turnoverratio for 2009. Cost of Good Sold Inventory Turnover = Average Inventory $1,011,500 = 8.1 times ($133,000 + $115,500) / 2 Inventory turnover measures the number of times, on average, the inventory is sold during the period. LO 5 Identify and compute ratios used in analyzing a firm’s liquidity, profitability, and solvency.
Liquidity Ratios Ratio Analysis Inventory Turnover $1,011,500 = 8.1 times ($133,000 + $115,500) / 2 A variant of inventory turnover is the days in inventory. 365 days / 8.1 times = every 45.1 days Inventory turnover ratios vary considerably among industries. LO 5 Identify and compute ratios used in analyzing a firm’s liquidity, profitability, and solvency.
Profitability Ratios Ratio Analysis Compute the Profit Marginratio for 2009. Net Income Profit Margin = Net Sales $199,000 = 10.9% $1,818,500 Measures the percentage of each dollar of sales that results in net income. LO 5 Identify and compute ratios used in analyzing a firm’s liquidity, profitability, and solvency.
Profitability Ratios Ratio Analysis Compute the Asset Turnoverratio for 2009. Net Sales Asset Turnover = Average Assets $1,818,500 = 2.0 times ($970,200 + $852,800) / 2 Measures how efficiently a company uses its assets to generate sales. LO 5 Identify and compute ratios used in analyzing a firm’s liquidity, profitability, and solvency.
Profitability Ratios Ratio Analysis Compute the Return on Assetsratio for 2009. Net Income Return on Assets = Average Assets $199,000 = 21.8% ($970,200 + $852,800) / 2 An overall measure of profitability. LO 5 Identify and compute ratios used in analyzing a firm’s liquidity, profitability, and solvency.
Profitability Ratios Ratio Analysis Compute the Return on Common Stockholders’ Equity ratio for 2009. Return on Common Stockholders’ Equity Net Income – Preferred Dividends = Average Common Stockholders’ Equity $199,000 - $0 = 38.6% ($566,700 + $465,400) / 2 Shows how many dollars of net income the company earned for each dollar invested by the owners. LO 5 Identify and compute ratios used in analyzing a firm’s liquidity, profitability, and solvency.
Profitability Ratios Ratio Analysis Compute the Earnings Per Share for 2009. Net Income Earnings Per Share = Weighted Average Common Shares Outstanding $199,000 = $3.49 per share 57,000 (given) A measure of the net income earned on each share of common stock. LO 5 Identify and compute ratios used in analyzing a firm’s liquidity, profitability, and solvency.
Profitability Ratios Ratio Analysis Compute the Price Earnings Ratio for 2009. Price Earnings Ratio Market Price per Share of Stock = Earnings Per Share $25 (given) = 7.16 times $3.49 The price-earnings (P-E) ratio reflects investors’ assessments of a company’s future earnings. LO 5 Identify and compute ratios used in analyzing a firm’s liquidity, profitability, and solvency.
Profitability Ratios Ratio Analysis Compute the Payout Ratio for 2009. Cash Dividends Payout Ratio = Net Income * $77,700 = 39% $199,000 Measures the percentage of earnings distributed in the form of cash dividends. * From analysis of retained earnings. LO 5 Identify and compute ratios used in analyzing a firm’s liquidity, profitability, and solvency.
Solvency Ratios Ratio Analysis Compute the Debt to Total Assets Ratio for 2009. Debt to Total Assets Ratio Total Debt = Total Assets $403,500 = 41.6% $970,200 Measures the percentage of the total assets that creditors provide. LO 5 Identify and compute ratios used in analyzing a firm’s liquidity, profitability, and solvency.
Solvency Ratios Ratio Analysis Compute the Times Interest Earned ratio for 2009. Income before Income Taxes and Interest Expense Times Interest Earned = Interest Expense $199,000 + $84,000 + $18,000 = 16.7 times $18,000 Provides an indication of the company’s ability to meet interest payments as they come due. LO 5 Identify and compute ratios used in analyzing a firm’s liquidity, profitability, and solvency.