Electroencephalography
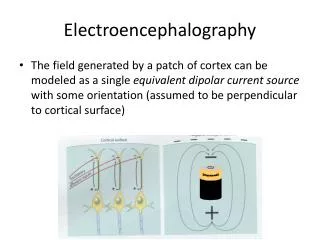
Electroencephalography. The field generated by a patch of cortex can be modeled as a single equivalent dipolar current source with some orientation (assumed to be perpendicular to cortical surface). Duracell. Electroencephalography.

Electroencephalography
E N D
Presentation Transcript
Electroencephalography • The field generated by a patch of cortex can be modeled as a single equivalent dipolar current source with some orientation (assumed to be perpendicular to cortical surface) Duracell
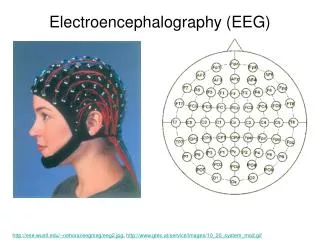
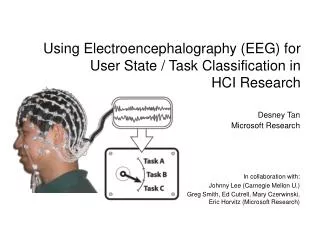
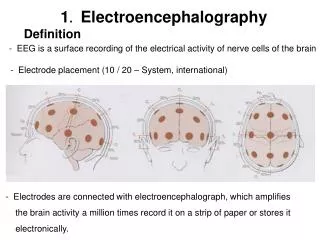
Electroencephalography • Electrical potential is usually measured at many sites on the head surface • More is sometimes better
Magnetoencephalography • For any electric current, there is an associated magnetic field Electric Current Magnetic Field
Magnetoencephalography • For any electric current, there is an associated magnetic field • magnetic sensors called “SQuID”s can measure very small fields associated with current flowing through extracellular space Electric Current Magnetic Field SQuID Amplifier
Magnetoencephalography • MEG systems use many sensors to accomplish source analysis • MEG and EEG are complementary because they are sensitive to orthogonal current flows • MEG is very expensive
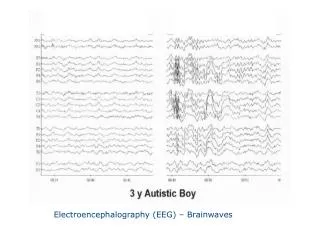
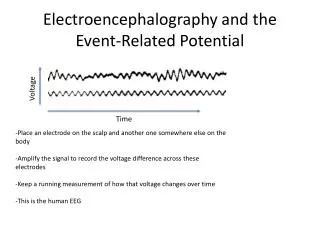
EEG/MEG • EEG changes with various states and in response to stimuli
Two ways to approach EEG data • The Event-Related Potential • Phase-locked or “evoked” • High inter-trial phase consistency • Retains polarity information at scalp • Rejects time-locked but not phase-locked changes • Time/Spectral Analysis • Includes Non-phase-locked or “induced” plus “evoked” signal • Ignores inter-trial phase consistency (measured differently) • Rejects polarity at scalp
Time-Frequency Analysis of EEG/MEG • Any complex waveform can be decomposed into component frequencies • E.g. • White light decomposes into the visible spectrum • Musical chords decompose into individual notes
Time-Frequency Analysis of EEG/MEG • EEG is characterized by various patterns of oscillations • These oscillations superpose in the raw data 4 Hz 4 Hz + 8 Hz + 15 Hz + 21 Hz = 8 Hz 15 Hz 21 Hz
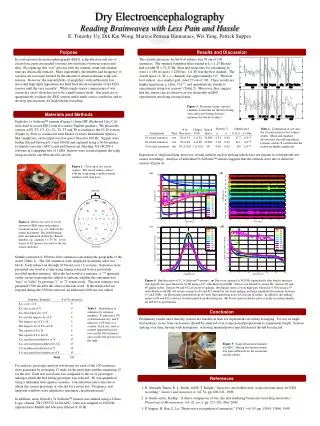
Time-Frequency Analysis of EEG/MEG • The amount of energy at any frequency is expressed as % power change relative to pre-stimulus baseline • Power can change over time 48 Hz % change From Pre-stimulus 24 Hz 16 Hz Frequency 8 Hz 4 Hz +200 +400 +600 0 (onset) Time
Time-Frequency Analysis of EEG/MEG • We can select and collapse any time/frequency window and plot relative power across all sensors Win Lose
The Event-Related Potential (ERP) • Embedded in the EEG signal is the small electrical response due to specific events such as stimulus or task onsets, motor actions, etc.
The Event-Related Potential (ERP) • Embedded in the EEG signal is the small electrical response due to specific events such as stimulus or task onsets, motor actions, etc. • Averaging all such events together isolates this event-related potential
The Event-Related Potential (ERP) • We have an ERP waveform for every electrode
The Event-Related Potential (ERP) • We have an ERP waveform for every electrode
The Event-Related Potential (ERP) • We have an ERP waveform for every electrode • Sometimes that isn’t very useful
The Event-Related Potential (ERP) • We have an ERP waveform for every electrode • Sometimes that isn’t very useful • Sometimes we want to know the overall pattern of potentials across the head surface • isopotential map
The Event-Related Potential (ERP) • We have an ERP waveform for every electrode • Sometimes that isn’t very useful • Sometimes we want to know the overall pattern of potentials across the head surface • isopotential map Sometimes that isn’t very useful - we want to know the generator source in 3D
Brain Electrical Source Analysis • Given this pattern on the scalp, can you guess where the current generator was? • Source Imaging in EEG/MEG attempts to model the intracranial space and “back out” the configuration of electrical generators that gave rise to a particular pattern of EEG on the scalp Duracell
Brain Electrical Source Analysis • EEG data can be coregistered with high-resolution MRI image Source Imaging Result Structural MRI with EEG electrodes coregistered
CCBN Dense-Array EEG Data Files Event Triggers Stimuli Raw EEG .raw MatLab Fieldtrip BrainVoyager SPSS -EEG spectral analysis - MRI coregistration Netstation – records EEG and event triggers .sfp BESA -post-processing -ERP averaging -voltage maps -source imaging Digamize –records electrode locations MANUSCRIPT
Basic Elements of ERP Design • EEG, therefore ERP, doesn’t provide interpretable absolute voltage • The voltage is always relative to something else • That something else may be: • The pre-stimulus baseline • A control condition
Basic Elements of ERP Design • Thus a fundamental aspect of ERP design is not to plan to report voltages but rather a difference in voltage between two or more conditions • What are some examples of conditions you might want to compare?
First Demo • Contralaterality in Visual System • Hemifields project to contralateral cortex • Unrelated to which eye is stimulated! • Occular Albinism • Eyes project contralaterally, irrespective of hemifield
Basic Elements of ERP Design • The theory is that human visual cortex is organized contralaterally • The prediction is that right hemifield stimuli will drive electrical activity in the left visual cortex and left hemifield stimuli will drive electrical activity in right visual cortex • How do we test that prediction?
Basic Elements of ERP Design • Experimental approach: • Choices: • 1. you could compare ipsi to contra ERP waveforms with a trial • E.g. O3 with O4 • What’s the problem? O4 O3
Basic Elements of ERP Design • Experimental approach: • Choices: • 1. you could compare ipsi to contra ERP waveforms with a trial • E.g. O3 with O4 • What’s the problem? • You would be comparing ERPs from different parts of the brain! • How could you improve on that design?
Basic Elements of ERP Design • Experimental approach: • Choices: • 2. you could compare electrodes ipsi to stimulus on one side with electrodes contra to stimulus on the other side • Notice those are the same electrode! Measure contralateral ERP magnitude O3
Basic Elements of ERP Design • Experimental approach: • Choices: • 2. you could compare electrodes ipsi to stimulus on one side with electrodes contra to stimulus on the other side • Notice those are the same electrode! Measure ipsilateral ERP magnitude O3
Hands on agenda today: • Orientation to the EEG lab • Build your dipole models
How do we represent a continuously variable signal digitally? • Sampling • Sampling rate – number of measurements per unit time • Sampling depth or quantization – number of gradations by which the measurement can be recorded
How do we represent a continuously variable signal digitally? • Sampling • What would be the advantage to higher sampling rates?
How do we represent a continuously variable signal digitally? • Sampling • What would be the advantage to higher sampling rates? • Nyquist limit
How do we represent a continuously variable signal digitally? • Sampling • What would be the advantage to higher sampling rates? • Nyquist limit • Aliasing • What would be the disadvantage? • Data size • Compute time
How do we represent a continuously variable signal digitally? • Sampling • What would be the advantage to greater sampling depth? • Finer resolution • What would be the disadvantage? • Data size • Possibly compute time
How do we represent a continuously variable signal digitally? • Sampling • A note about data size and compute time: • New data size = increase in quantization x number of samples x number of electrodes!
What is a filter? • Filters let some “stuff” through and keep other “stuff” from getting through • What do we want to let through? • What do we want to filter out?
What is a filter? • The goal of filtering is to improve the signal to noise ratio • Can the filter add signal?
Different Kinds of Filters • Low-Pass (High-Cut-Off) • High-Pass (Low-Cut-Off) • Band-Pass • Notch • Each of these will have a certain “slope”
How do Filters Work? • Notionally: • Transform to frequency domain • Mask some parts of the spectrum • Transform back to time domain
Are There Any Drawbacks? • Yes • Filters necessarily distort data • Amplitude distortion • Latency distortion • Forward/backward/zero-phase
Recommendations • Should you filter? • Yes, when necessary to reveal a real signal • Problem: how do you know it’s “real” • No, always look at the unfiltered data first • What filters should you use? • Depends on your situation (e.g. what EEG band are you interested in? Do you have 60Hz line noise?) • General rule: less aggressive filters are less distorting