Download
1 / 37
370 likes | 445 Views
Learn about implementing targeted quality control to optimize batch sampling, save costs, and improve efficiency in production. Discover how ATOFINA, a chemical company, successfully applied this innovative approach.

E N D
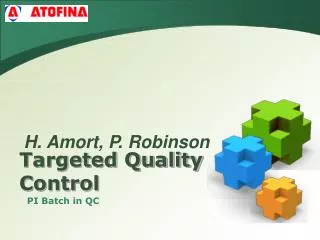
H. Amort, P. Robinson Targeted Quality Control PI Batch in QC
Contents 1 Company Info 2 The Idea 3 Implementation 4 Current Status 5 Future Plans
Company Info ATOFINA Chemicals, Inc. ATOFINA Total HQ: Paris, France Emp: 121,500 Sales: $118 billion HQ: Philadelphia Emp: 2,600 Sales: $1.5 billion HQ: Paris, France Emp: 61,000 Sales: $19 billion
Introduction Quality control (QC) necessary step in production to assure critical product properties. But QC is expensive: • Labor and equipment • Batch delay awaiting results before transfer
Quality control limits Commonly QC limits are set symmetrically around a target value. There is a lower and upper spec limit. All products that fall between this limits are in-spec, all other products off-spec.
QC benefit and cost Limits = ± 1 stdev. In-spec: 68% Off-spec: 32% Or in other words: For every $1 spent,68 cents are wasted.
More realistic Limits = ± 3 stdev. In-spec: 99.7% Off-spec: 0.3% Or in other words: For every $1 spent,99 cents are wasted.
Targeted quality control Rather than sample every batch why not just sample the batches which look unlike previous good batches? The potential cost savings are substantial. Example: 150 batches / year 3 h. lag time 3,500 $/operational hour = 1.6 M$ 70% reduction = 1.12 M$
Targeted Quality Control • Instead of 100% now sample only 30% • A question of where to draw the line • Tighter limit -> greater savings -> more risk of missing a “bad” batch • As confidence grows, limit can be tightened further • More data allow correlation improvements
Situation in Atofina’s Mobile plant Some key properties difficult/time consuming to measure Specification limits are set appropriately(> 99%) “In 2003 some products never failed quality control … but we still measured all of them.”
Model Creation • Collect historical batch profiles and QC results
Model Creation • Collect historical batch profiles and QC results • Batch Alignment (Dynamic Time Warping)
Model Creation • Collect historical batch profiles and QC results • Batch Alignment (Dynamic Time Warping) • Data centering • Model generation • Relevant factors • Calculated values
Model Creation 1.05 1 0.95 predicted 0.9 0.85 0.8 0.8 0.85 0.9 0.95 1 1.05 observed
Model Creation • Collect historical batch profiles and QC Results • Batch Alignment (Dynamic Time Warping) • Data centering • Model generation • Relevant factors • Calculated values • Control limits • Output to .csv
TQC elements Profile Processing: • New batch profile • Input from .csv model file • Batch Alignment • Data centering • Calculate parameter • Submit to testing (Pass/Fail) Fail means “sample to QC”
PI-Global Support Team • Team formed to facilitate PI developments worldwide within Atofina Chemicals • Assist in PI installations, upgrades, new interfaces, etc. • Particularly interested in plant-based initiatives with application across the company • TQC a perfect example
PI Implementation Two Parts (for PI-Global Support Team): • Real-time profile processing • ProcessBook-based VBA code • To be used in unit by operators to determine whether batch should be sampled • Simple yes/no answer • Semi-Automated Model Generation • Excel-based VBA code • Makes model generation more convenient • Includes simple outlier identification
Profile Processing • Equations working fine in Excel with manually collected batch data • ProcessBook created with equations pasted in as modules • Simple BatchView control used to select a batch (nice functionality for testing)
Profile Processing • Model only requires a small portion of the batch profile (reaction step) • For example, beginning of Step 15 to end of Step 20 • ProcessBook code returns start and end time based on these specified flags
Profile Processing • Equations require a fixed sample size… 128 points for now • PB code makes piar_timedvalues call to retrieve evenly spaced samples over flag-based time period
Profile Processing • PB code imports model .csv file and runs equations…returns a Pass/Fail msgbox • Great thing about using ProcessBook… equations imported directly into a PB…called from PB VBA code just as in Excel VBA code…only difference is the source of the data
Model Generation • Initially, model generation was manual • Took some time to extract data by hand using DataLink in Excel, then run modeling code like a macro • Created Model Generation spreadsheet to make things easier • Again, equations simply pasted into spreadsheet and called when needed.
Model Generation • Batch selection is automatic based on user-specified search criteria • Flags are also user-specified and can be checked for validity • Some steps/unit actions not used in some recipes • Some steps/unit actions prone to being missed by PI (slow interface) • Simple outlier identification routine • Generate model .csv file
Control limits limit = 0.8 , selected = 0 or [0%] 1.05 1 0.95 0.9 predicted 0.85 0.8 0.75 0.75 0.8 0.85 0.9 0.95 1 1.05 observed
Control limits limit = 0.85, selected = 3 or [12.5%] 1.05 1 0.95 0.9 predicted 0.85 0.8 0.75 0.75 0.8 0.85 0.9 0.95 1 1.05 observed
Control limits limit = 0.875, selected = 7 or [~30%] 1.05 1 0.95 0.9 predicted 0.85 0.8 0.75 0.75 0.8 0.85 0.9 0.95 1 1.05 observed
All samples 100% Off-spec 0.3% TQC 30% Targeted Quality Control
Status Literature review Implemented higher sampling rate Developed statistical part in VBA Developed user interface in PI process book Prototype ready Models for one product in two reactors
Future Plans • 1st implementation for single product • Extend to more products/vessels • Requires naming convention for model .csv’s • Flag tags included in model .csv’s • Error handling • Procedures • Operator training • Automatic detection of “end of profile” • Use sub-batch functionality
Thanks… Any questions?