Download
1 / 6
60 likes | 202 Views
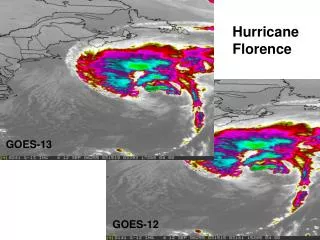
Comparison Synthetic and Observed GOES-13 Imagery of hurricane Earl Lewis Grasso a Daniel T. Lindsey b Clark Evans c a Cooperative Institute for Research in the Atmosphere (CIRA ) Colorado State University, Fort Collins, CO 80523-1375 Lewis.Grasso@colostate.edu

E N D
Comparison Synthetic and Observed GOES-13 Imagery of hurricane EarlLewis Grassoa Daniel T. Lindseyb Clark Evansc aCooperativeInstitute for Research in the Atmosphere (CIRA) Colorado State University, Fort Collins, CO 80523-1375 Lewis.Grasso@colostate.edu bNOAACenter for Satellite Applications and ResearchcDepartment of Mathematical Sciences University of Wisconsin-Milwaukee 25 April 2014
Simulation of hurricane Earl WRF-ARW V3.4.1 Initialization time: 1 September 2010 at 0000 UTC Time of analysis: 3 September 2010 at 0600 UTC NXP: 1000, NYP:1000, NZP:31 DX=DY=4 km Hugh Morrison two-moment microphysics Observed satellite data 1) GOES-13 10.7 and 6.48 um at 0615 UTC Synthetic satellite data CRTM V2.0.5 Particles sizes pre-computed based on Morrison scheme Spectrally dependent surface emissivity data from Eva Borba (CIMSS)
A B C D Figure 1. (A) Observed and (B) synthetic 6.48 µm GOES-13 imagery valid at 06 UTC on 3 September 2010. (C) Histograms of observed (solid lines) and synthetic (dashed lines) brightness temperatures and (D) zoomed in for brightness temperatures between 190 K and 250 K. The synthetic image is based on a 54 hour forecast from the WRF-ARW V3.4.1.
Figure 2. Same as Figure 1, except the imagery is at 10.7 µm.
Summary and conclusions Simulated hurricane is deeper and more intense than observed storm. Synthetic imagery exhibits too large an area that contains upper tropospheric ice clouds. Histograms support that too many synthetic pixels are too cold compared to observations.
References • Lewis Grasso, Daniel T. Lindsey, Kyo-Sun Lim, Adam Clark, and Dan Bikos, 2013: Evaluation of and Suggested Improvements to the WSM6 Microphysics in WRF-ARW Using Synthetic and Observed GOES-13 Imagery. Submitted to Monthly Weather Review. • Yi Jin, Shouping Wang, Jason Nachamkin, James D. Doyle, Gregory Thompson, Lewis Grasso, Teddy Holt, Jon Moskaitis, Hao Jin, Richard M. Hodur, Qingyun Zhao, Ming Liu, and Mark DeMaria, 2013: Evaluation of Microphysical Parameterizations for Tropical Cyclone Prediction. Mon. Wea. Rev.,142, 606-625. • Jankov I., L. Grasso, M. Sengupta, P. J. Neiman, D. Zupanski, M. Zupanski, D. Lindsey, Donald W. Hillger, Daniel L. Birkenheuer, R. Brummer, and Huiling Yuan, 2011: An Evaluation of Five WRF-ARW Microphysics Schemes Using Synthetic GOES Imagery for an Atmospheric River Event Affecting the California Coast. Journal of Hydrometeorology. Volume 12, Issue 4 (August 2011) pp. 618-633. doi: 10.1175/2010JHM1282.