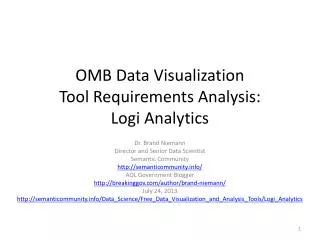
Data visualization in business analytics
Data visualization is a crucial component of business analytics, as it helps to present complex data in a clear and concise way. Effective visualization can lead to better insights, informed decision-making, and improved overall performance.

Data visualization in business analytics
E N D
Presentation Transcript
Quick Grasp of Massive and Complicated Data RPA is a generic tool that you can use to build specialized agents, or bots, which interact with GUI components to finish repetitive activities following rules. It is a type of clerical process automation technology that works on the concept of software robots or AI workers.
Better Data-Centric Decision Making • Business meetings, which discuss visual data tend to be shorter and reach consensus more easily as compared to meetings focussed on only text/numbers. Data visualization in business analytics helps viewers to get deeper insights into trends and make decisions quickly. Once you perfectly use the right data visualization systems, even your sales executive can understand customer behavior and perceptions.
How Does RPA Function? Audience Engagement Viewers get much more engaged when they can relate to data because of excellent visual presentation. As images evoke emotional reactions, data visualization can help in driving opinions and ultimately actions. Business intelligence visualization promotes collaboration and communication as numerous stakeholders can see the representation and discuss data insights.
Deeper Insights and Hidden Patterns Benefits of RPA Data visualization identifies patterns, trends, and relationships that aren't easily understandable from numerical data or any type of traditional representation. Data visualization in business analytics helps in obtaining deeper insights and interrelationships.
The Bottom Line So, here are the ways data visualization helps in enhancing the value of business intelligence. You can find and use a variety of tools and techniques to build an effective data visualization in business analytics. Thus, you and your workforce should interpret the inherent principles and choose to implement the right tools.
Thank you https://www.kulsys.com/ https://www.facebook.com/kulsystechnologies https://twitter.com/kulsys