Two-Way Frequency Tables for Categorical Data Analysis
120 likes | 195 Views
Learn to interpret and analyze categorical data using two-way frequency tables. Explore joint and marginal frequencies to draw insights. Calculate conditional and joint relative frequencies for informed decision-making.

Two-Way Frequency Tables for Categorical Data Analysis
E N D
Presentation Transcript
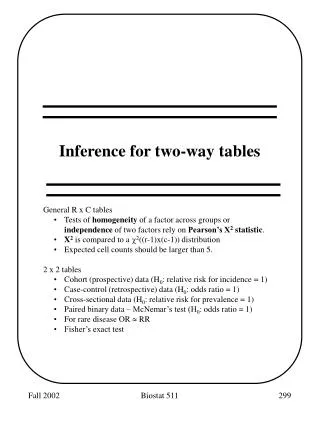
Two-Way Frequency Tables Summarize categorical data
Numerical vs. Categorical Data • Numerical data are data that can be placed on a numerical scale and compared. • data that are numbers. ie: height, weight, age, price, temperature, test scores, etc. • Categorical data are data that can be grouped into categories. • Data that aren’t numbers. ie: eye color, hair color, favorite ice cream, favorite superhero, city of birth, etc. • Two-Way Frequency Table / Frequency Distribution is a table that displays categorical data by representing the number of occurrences for two variables. (it’s the actual data results, # of people etc) • Marginal Frequency Distribution is a table that displays the total of the frequenciesof the rows or columns.
Data was collected from 100 men and 100 women about their favorite DC comic book superheroes: Wonder Woman, Batman, or Superman. • This is categorical data: the two variables are gender (male/female) and favorite superhero (WW, BM, SM) • Here data is displayed in a two-way frequency table (actual data results). • Here data is displayed in a marginal frequency distribution (includes totals) • Talk with the person next to you to determine how to read the table. What do the labels mean?
Data was collected from men and women about their favorite DC comic book superheroes: Wonder Woman, Batman, or Superman. • We learn some basic information from the table when it is displayed in this format. • 87 people prefer Wonder Woman. • Of the 87 people who prefer Wonder Woman, 62 of them were women.
Types of Frequencies: • Joint Frequency:The data within the body of a two-way table • the middle cells in yellow section • Marginal Frequency: The row total and column totals • the far right and the bottom blue sections • Conditional Relative Frequency will be a percent (more on next page) • Joint Relative Frequency will be a percent (more on next page)
Conditional Relative Frequency: Conditional Relative Frequency: Shows the ratio or percent of occurrences of a category compared to the total of that category (ratio of the joint frequency and related marginal frequency) • To calculate Conditional Frequency, you divide the cell total by the row total. • Set up fraction and divide • Calculate the conditional frequency of males who like Wonder Woman. • 25/100 = 25%. • To fill in the total column, divide the row total by the grand total. • Calculate the male total / grand total of people surveyed. • 100/200 = 50%. Cell total Row total Conditional Relative Frequency Table 100 100 87 25 62 35% 50% 25% 40% 200 200 200 100 100 50% 62% 23% 15% 25% 43.5% 31.5% 100%
Conditional Relative Frequency: • These are the types of questions that can be answered from conditional frequency tables. • What percent of males prefer Batman? • What percent of females prefer Superman? • What percent of the males surveyed prefer Wonder Woman? • A question you cannot answer from this table is, “What percent of the total people surveyed were women who liked Wonder Woman?” • The answer of 62% is not correct. That is the percent of JUST the women who like Wonder Woman.
Joint Relative Frequency: Joint Relative Frequency: Shows the ratio or percent of occurrences compared to the grand total number of occurrences • Calculate Joint Relative Frequency by dividing the cell total by the grand total. • Set up fraction and divide • Calculate the relative frequency of males who like wonder woman. Divide male votes for Wonder Woman by the grand total. • 25/200 = 0.125 or 12.5% Cell total Grand total Joint Relative Frequency Table 62 25 87 200 200 200 12.5% 50% 17.5% 20% 11.5% 7.5% 31% 50% 25% 43.5% 31.5% 100%
Joint Relative Frequencies: • Relative Frequency will allow you to answer the question, “What percent of all the people surveyed were women who like Wonder Woman?” • The marginal frequencies answer these types of questions: • What percent of the people surveyed were female? • What percent of the people surveyed liked Superman? • What percent of the people surveyed like Batman? 20% 50% 12.5% 17.5% 31% 50% 7.5% 11.5% • Now that the table has been changed to percents, you can make predictions. • What is the probability that a person picked at random from this group will be a female that likes Wonder Woman? • What is the probability that a person picked at random from this group will be a male who likes Superman? 31.5% 100% 25% 43.5% 31% 17.5%