Download

1 / 9
90 likes | 319 Views
Two-Way Tables. Some types of data are presented in two-way tables. You will be expected to be able to set up and read a two-way table. What does this number mean?. Two-Way Tables.

E N D
Two-Way Tables Some types of data are presented in two-way tables You will be expected to be able to set up and read a two-way table
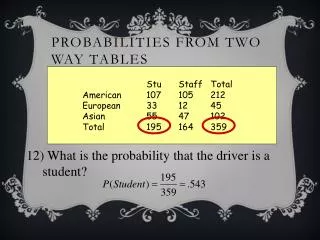
What does this number mean? Two-Way Tables Q1. The following table shows the distribution of numbers of brothers and sisters from a survey of a group of children. No. sisters No. brothers 3 people have 2 sisters and 1 brother
Two-Way Tables No. sisters No. brothers a.) How many children took part in the survey? d.) Jack made a hypothesis that most families have less than 5 members. Based on this sample, is he correct? 33 b.) How many children have i.) no brothers or sisters? ii.) one brother but no sisters? 4 Yes he is correct, there are many more families with less than 4 members than over 5 members. 7 c.) How many children are there in the largest family? e.) How many people have two sisters? 8 2 families have 2 brothers and 2 sisters so there are 5 children in the largest family
Analysing information The following information is factual information about a recent pop concert. Read through the paragraph before answering the questions. Robbie Williams performed a concert at Knebworth in front of a crowd of 100,000 people. 95,600 people travelled more than 50 miles to get there. 60% of people travelled by car. The remainder travelled by train. The average age of the viewers was 22 years old. a.) What was the average age of the viewers? b.) How many viewers travelled lessthan 50 miles? c.) What percentage of people travelled by train? d.) How many people travelled by car?
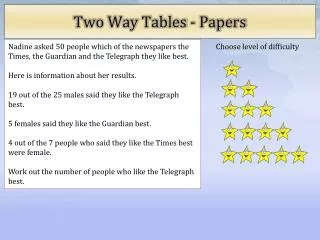
No. days 1 2 3 4 5 Postage First Class 12 4 2 0 1 Second Class 0 5 6 4 3 Question 1 The principle of a music school posted letters to all of his students. The number of days it took for the letters to arrive is summarised in the following table. a.) How many students are there at the music school? d.) Amy made a hypothesis that more second class letters would be delivered in the first three days. Based on the sample, was she correct? 37 b.) How many of the first class letters took more than a day to arrive? 7 No she was not correct – only 11 second class letters were delivered compared to 18 first class letters c.) How many letters took 3 days to arrive? 8
Question 2 The following information is factual information about TV viewing figures for a Saturday night. Read through the paragraph before answering the questions. 20 million people watched TV on a Saturday night. At 7pm 25% of viewers watched Strictly Come Dancing and the remained watched The X-Factor. 15.5 million of the viewers were female. 10 million of the viewers were under 20. a.) How many viewers were older than 20? b.) How many viewers watched The X-Factor? c.) How many viewers were male? d.) How many people watched Channel 4?
Question 3 The weight and mint year of a sample of 10p coins are listed. 1998 – 10.3g 1996 – 9.8g 1996 – 10.0g 1998 – 10.5g 1999 – 11.0g 1999 – 10.8g 1997 – 9.9g 1997 – 10.2g 1999 – 10.9g 1996 – 9.6g 1997 – 10.5g 1996 – 9.8g 1996 – 20.2g 1998 – 10.3g 1998 – 10.4g Which coin do you think has been incorrectly recorded?
Question 3 1998 – 10.3g 1996 – 9.8g 1996 – 10.0g 1998 – 10.5g 1999 – 11.0g 1999 – 10.8g 1997 – 9.9g 1997 – 10.2g 1999 – 10.9g 1996 – 9.6g 1997 – 10.5g 1996 – 9.8g 1996 – 20.2g 1998 – 10.3g 1998 – 10.4g Ignoring this coin – copy and complete the table Year Weight (g) 4 1 0 0 0 2 4 0 0 0 0 3 Comment on the results – can you seen any pattern?
Further Questions 4.) Carry out a survey top find out the number of brothers and sisters each person in your class has. Record the data in a two way table. 5.) Design a two-way table to find the types of CDs boys and girls in your class have bought in the last three months. 6.) It is thought that the weight of a fruit pastille is linked to its colour. Design a two-way table to collect data to test this idea.