Download
1 / 19
190 likes | 325 Views
Chapter 9 Introduction to the t-statistic. PSY295 Spring 2003 Summerfelt. Overview. CLT or Central Limit Theorem z-score Standard error t-score Degrees of freedom. Learning Objectives. Know when to use the t statistic for hypothesis testing Understand the relationship between z and t

E N D
Chapter 9Introduction to the t-statistic PSY295 Spring 2003 Summerfelt
Overview • CLT or Central Limit Theorem • z-score • Standard error • t-score • Degrees of freedom
Learning Objectives • Know when to use the t statistic for hypothesis testing • Understand the relationship between z and t • Understand the concept of degrees of freedom and the t distribution • Perform calculations necessary to compute t statistic • Sample mean & variance • estimated standard error for X-bar
Central limit theorem • Based on probability theory • Two steps • Take a given population and draw random samples again and again • Plot the means from the results of Step 1 and it will be a normal curve where the center of the curve is the mean and the variation represents the standard error • Even if the population distribution is skewed, the distribution from Step 2 will be normal!
Z-score Review • A sample mean (X-bar) approximates a population mean (μ) • The standard error provides a measure of • how well a sample mean approximates the population mean • determines how much difference between X-bar and μ is reasonable to expect just by chance • The z-score is a statistic used to quantify this inference • obtained difference between data and hypothesis/standard distance expected by chance
What’s the problem with z? • Need to know the population mean and variance!!! Not always available.
What is the t statistic? • “Cousin” of the z statistic that does not require the population mean (μ) or variance (σ2)to be known • Can be used to test hypotheses about a completely unknown population (when the only information about the population comes from the sample) • Required: a sample and a reasonable hypothesis about the population mean (μ) • Can be used with one sample or to compare two samples
When to use the t statistic? • For single samples/groups, • Whether a treatment causes a change in the population mean • Sample mean consistent with hypothesized population mean • For two samples, • Coming later!
Difference between X-bar and μ • Whenever you draw a sample and observe • there is a discrepancy or “error” between the population mean and the sample mean • difference between sample mean and population • Called “Sampling Error” or “Standard error of the mean” • Goal for hypothesis testing is to evaluate the significance of discrepancy between X-bar & μ
Hypothesis Testing Two Alternatives • Is the discrepancy simply due to chance? • X-bar = μ • Sample mean approximates the population mean • Is the discrepancy more than would be expected by chance? • X-bar ≠μ • The sample mean is different the population mean
Standard error of the mean • In Chapter 8, we calculated the standard error precisely because we had the population parameters. • For the t statistic, • We use sample data to compute an “Estimated Standard Error of the Mean” • Uses the exact same formula but substitutes the sample variance for the unknown population variance • Or you can use standard deviation
Common confusion to avoid • Formula for sample variance and for estimated standard error (is the denominator n or n-1?) • Sample variance and standard deviation are descriptive statistics • Describes how scatted the scores are around the mean • Divide by n-1 or df • Estimated standard error is a inferential statistic • measures how accurately the sample mean describes the population mean • Divide by n
The t statistic • The t statistic is used to test hypotheses about an unknown population mean (μ) in situations where the value of (σ2) is unknown. • T=obtained difference/standard error • What’s the difference between the t formula and the z-score formula?
t and z • Think of t as an estimated z score • Estimation is due to the unknown population variance (σ2) • With large samples, the estimation is good and the t statistic is very close to z • In smaller samples, the estimation is poorer • Why? • Degrees of freedom is used to describe how well t represents z
Degrees of freedom • df = n – 1 • Value of df will determine how well the distribution of t approximates a normal one • With larger df’s, the distribution of the t statistic will approximate the normal curve • With smaller df’s, the distribution of t will be flatter and more spread out • t table uses critical values and incorporates df
Four step procedure for Hypothesis Testing • Same procedure used with z scores • State hypotheses and select a value for α • Null hypothesis always state a specific value for μ • Locate a critical region • Find value for df and use the t distribution table • Calculate the test statistic • Make sure that you are using the correct table • Make a decision • Reject or “fail to reject” null hypothesis
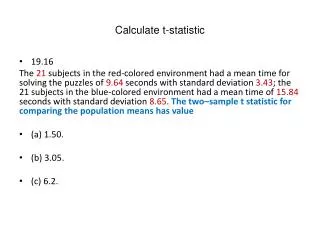
Example • GNC is selling a memory booster, should you use it? • Construct a sample (n=25) & take it for 4 weeks • Give sample a memory test where μ is known to be 56 • Sample produced a mean of 59 with SS of 2400 • Use α=0.05 • What statistic will you use? Why?
Steps • State Hypotheses and alpha level • Locate critical region (need to know n, df, & α) • Obtain the data and compute test statistic • Make decision