Chapter 9 Introduction to the t Statistic
Chapter 9 Introduction to the t Statistic. PowerPoint Lecture Slides Essentials of Statistics for the Behavioral Sciences Seventh Edition by Frederick J Gravetter and Larry B. Wallnau. Chapter 9 Learning Outcomes. Concepts to review. Sample standard deviation (Chapter 4)

Chapter 9 Introduction to the t Statistic
E N D
Presentation Transcript
Chapter 9Introduction to the t Statistic PowerPoint Lecture SlidesEssentials of Statistics for the Behavioral SciencesSeventh Editionby Frederick J Gravetter and Larry B. Wallnau
Concepts to review • Sample standard deviation (Chapter 4) • Degrees of freedom (Chapter 4) • Standard error (Chapter 7) • Hypothesis testing (Chapter 8)
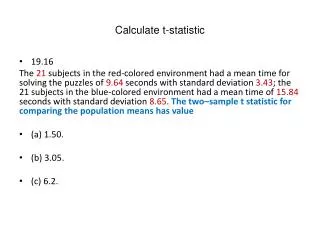
9.1 The t Statistic: Alternative to z • Sample mean (M) approximates population mean (μ) • Standard error describes how much difference is reasonable to expect between M and μ.
z-score statistic • Use z-score statistic to quantify inferences about the population. • Use unit normal table to find the critical region if z-scores form a normal distribution • When n≥ 30 or • When the original distribution is approximately normally distributed
Problem with z-scores • The z-score requires more information than researchers typically have available • Requires knowledge of the population standard deviation σ • Researchers usually have only the sample data available
Estimated standard error • Use s2 to estimate σ2 • Estimated standard error: • Estimated standard error is used as estimate of the real standard error when the value of σm is unknown.
The t-Statistic • The t-statistic uses the estimated standard error in place of σm • The t statistic is used to test hypotheses about an unknown population mean μ when the value of σ is also unknown
Degrees of freedom • Computation of sample variance requires computation of the sample mean first. • Only n-1 scores in a sample are independent • Researchers call n-1the degrees of freedom • Degrees of freedom • Noted as df • df = n-1
Figure 9.1 Distributions of the t statistic
The t Distribution • Family of distributions, one for each value of degrees of freedom. • Approximates the shape of the normal distribution • Flatter than the normal distribution • More spread out than the normal distribution • More variability (“fatter tails”) in t distribution • Use Table of values of t in place of the Unit Normal Table for hypothesis tests.
9.2 Hypothesis tests with the t statistic • Null hypothesis for one-sample t test statistic
Figure 9.3 Basic experimental situation for t statistic
Four steps for hypothesis testing • State the null and alternative hypothesesSelect an alpha level • Locate the critical region using the t distribution table and df • Calculate the t test statistic • Make a decision regarding H0
Figure 9.4 Critical region in the tdistribution for α = .05 and df = 8.
Assumptions of the t test • Values in the sample are independent observations. • The population sampled must be normal. • With large samples, this assumption can be violated without affecting the validity of the hypothesis test.
Learning Check • When n is small (less than 30), the t distribution ______.
Learning Check - Answer • When n is small (less than 30), the t distribution ______.
Learning Check • Decide if each of the following statements is True or False.
9.3 Measuring Effect Size • Hypothesis test determines whether the treatment effect is greater than chance • No measure of the size of the effect is included • A very small treatment effect can be statistically significant • Results from a hypothesis test should be accompanied by a measure of effect size
Cohen’s d • Original equation included population parameters • Estimated Cohen’s d is computed using the sample standard deviation
Figure 9.5 Distribution for Examples 9.1 and 9.2
Percentage of variance explained • Determining the amount of variability in scores explained by the treatment effect is an alternative method for measuring effect size. • r2= 0.01 small effect • r2= 0.09 medium effect • r2= 0.25 large effect
Figure 9.6 Deviations with and without the treatment effect
9.4 Directional Hypotheses and One-tailed Tests • Non-directional test is more commonly used • Directional test may be used for particular research situations • Four steps of hypothesis test are carried out • The critical region is defined in just one tail of the t distribution.
Figure 9.7 Critical region in the t curve for one-tailed test
Learning Check • The results of a hypothesis test are reported as follows: t(21) = 2.38, p < .05. What was the statistical decision and how big was the sample?
Learning Check - Answer • The results of a hypothesis test are reported as follows: t(21) = 2.38, p < .05. What was the statistical decision and how big was the sample?
Learning Check • Decide if each of the following statements is True or False.