Team Initiated Problem Solving
Team Initiated Problem Solving. Rob Horner, Steve Newton, & Anne Todd, University of Oregon Bob Algozzine & Kate Algozzine, University of North Carolina at Charlotte Coaches Conference Feb 3, 2010 Oregon State University www.swis.org robh@uoregon.edu awt@uoregon.edu. Anne Todd.

Team Initiated Problem Solving
E N D
Presentation Transcript
Team Initiated Problem Solving Rob Horner, Steve Newton, & Anne Todd, University of Oregon Bob Algozzine & Kate Algozzine, University of North Carolina at Charlotte Coaches Conference Feb 3, 2010 Oregon State University www.swis.org robh@uoregon.edu awt@uoregon.edu Anne Todd
Today’s Goals • Coaches are able to: • Prompt & support facilitator, minute taker and data analyst to prepare for meetings • Meeting Foundations Checklist • Prompt the use of the TIPS model during meetings • Data-based Decision-making rules • Help teams stay focused during meetings • Electronic Meeting Minute format Clarification • Coaches are NOT expected to be Trainers • Trainers deliver TIPS team training & help Coaches anticipate errors while guiding them through the possible solutions & adaptations
Context • Every school has teams • Teams are being expected to do problem solving • Select curricula • Get training and implement new ideas/programs • Provide efficient leadership • “Communities of Practice” • Teams need to report data to administration, district, state • Teams NEED data to do good problem solving. • Most teams are not skilled at running problem solving meetings and using data for decision-making.
Assumption: Coaching is Critical • Teams will need more than a manual or brief training to become skilled at use of data for efficient problem solving • Coaching will be a key element to successful use of good problem solving procedures.
What do we need? • A clear model with steps for problem solving • Access to the right information at the right time in the right format • A formal process that a group of people can use to build and implement solutions.
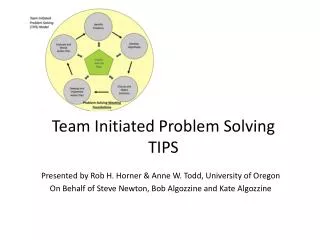
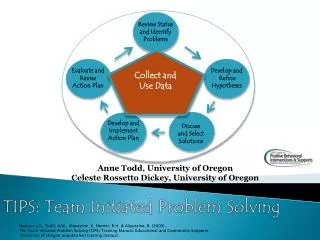
Team Initiated Problem Solving (TIPS) Model Review Status and Identify Problems Develop and Refine Hypotheses Evaluate and Revise Action Plan Collect and Use Data Discuss and Select Solutions Develop and Implement Action Plan Problem Solving Meeting Foundations
TIPS Model • TIPS Training • One full day team training • Two coached meetings • Team Meeting • Use of electronic meeting minute system • Formal roles (facilitator, recorder, data analyst) • Specific expectations (before meeting, during meeting, after meeting) • Access and use of data • Projected meeting minutes • Research tool to measure effectiveness of TIPS Training • DORA (decision, observation, recording and analysis) • Measures “Meeting Foundations” & “Thoroughness of Problem Solving”
Evidence of Effectiveness • Evaluation Study (2007-08) • Newton et al., • Single-case Study (2008-09) • Todd et al., • Group Design Study (2009-10)
Baseline Coaching TIPS TIPS Study: Todd et al., 2009 Meeting Foundations Score School A School B % DORA Foundations Score School C School D
TIPS Study: Todd, et al, 2009. Baseline Coaching TIPS Thoroughness of decision-making School A % DORA Thoroughness Score School C School D
Building Capacity and Sustainability For Social Competence, Academic Achievement, and Safety OUTCOMES *Meeting time *Support *Report to Faculty SWIS SYSTEMS DATA Electronic Meeting Minutes Form PRACTICES Supporting Staff & Student Behavior and Decision Making
Improving Decision-Making via Problem Solving Action Planning & Evaluation Problem Solving Problem Solution Information/ Data
Problem-Solving Meeting Foundations Structure of meetings lays foundation for efficiency & effectiveness
Using Meeting Minutes • Documentation of • Logistics of meeting (date, time, location, roles) • Agenda items for today’s meeting ( and next meeting) • Discussion items, decisions made, tasks and timelines assigned • Problem statements, solutions/decisions/tasks, people assigned to implement with timelines assigned, and an evaluation plan to determine the effect on student behavior • Reviewing Meeting minutes • An effective strategy for getting a snapshot of what happened at the previous meeting and what needs to be reviewed during the upcoming meeting • What was the issue/problem?, What were we going to do?, Who was going to do it and by When?, and How are we measuring progress toward the goal? • Visual tracking of focus topics during and after meetings • Prevents side conversations • Prevents repetition • Encourages completion of tasks
Organizing for an effective problem solving conversation A key to collective problem solving is to provide a visual context that allows everyone to follow and contribute Problem Use Data Out of Time Solution
PBIS Team Meeting Minutes and Problem-Solving Action Plan Form Today’s Meeting: Date, time, location: Facilitator: Minute Taker: Data Analyst: Next Meeting: Date, time, location: Facilitator: Minute Taker: Data Analyst: Team Members (bold are present today) Administrative/General Information and Issues Problem-Solving Action Plan Evaluation of Team Meeting (Mark your ratings with an “X”)
Important Structural Components • Regular meetings & regular attendance • The “right” people • The right roles • Facilitator • Minute Taker • Data Analyst • Active Team Members • The right information for problem solving & decision making • Accomplishments – Products of successful meeting • Meeting Minutes (record of decisions & tasks concerning administrative/general issues) • Problem-Solving Action Plan (record of decisions & tasks concerning problems identified by team)
Before the Meeting… • Room reserved • “New” items solicited for agenda • Agenda produced • Team member roles determined • Data reviewed by Data Analyst before the meeting; Analyst ready to lead team through discussion of (a) possible new problems and (b) effects of in-process solutions on “old” problems • Computer reserved; access to SWIS online database assured • LCD projector reserved & set up to project data (or team has some other strategy for ensuring team members can review data at meeting) • Team members have individual TIPS Notebooks to bring to meeting(We’ll review the (a) before-meeting, (b) during-meeting, and (c) after-meetings responsibilities of individual team members later in this workshop)
At Close of and After Meeting… • Meeting Minutes and Problem-Solving Action Plan completed • Copy of Meeting Minutes & Problem-Solving Action Plan distributed to each member within 24 hrs.
Activity • Complete the Foundations Checklist • Use the PBIS team you know best • How would you use the Foundations Checklist to help a school team that was preparing to adopt TIPS procedures?
Identify Problems Team Initiated Problem Solving (TIPS) Model Develop Hypothesis Evaluate and Revise Action Plan Collect and Use Data Discuss and Select Solutions Develop and Implement Action Plan Problem SolvingMeeting Foundations
SWISTM(School-Wide Information System) • Defined • SWISTM is a web-based information system for gathering, entering, summarizing, reporting and using office discipline referral information • Purpose • A progress monitoring tool for improving the ability of school personnel to develop safe and effective learning environments
Three Key Elements of SWISTM • Data Collection System • Coherent system for assigning referrals • Prob. behavior definitions, referral form, rules for referral • Allocation of FTE to enter data, build reports. • Computer Application • Web-based, continuously available, secure • Decision-making • Use of data • School-wide • Individual Student
Features of SWISTM • Only reports discipline data • Major office referrals • Minor discipline offences • Highly efficient (30 sec per referral) • Local control • Formatted for decision-making (pictures) • Information is available continuously • Confidential, secure • Can be combined with district data base
How SWISTM works • Data Entry • School Address and Contact • Enrollment/Ethnicity/Days per month • Staff Information • Student Information • Referrals • Reporting • Average Referrals per Day per month • Referrals by Problem Behavior • Referrals by Location • Referrals by Time • Referrals by Student • Other Reports • Tools
Total Office Discipline Referrals as of January 10 Total Office Discipline Referrals
Organizing SWIS Data for Decision-making • Universal Screening Tool • Proportion of students with • 0-1 Office Discipline Referrals (ODRs) • 2-5 ODRs • 6+ ODRs • Progress Monitoring Tool • Compare data across time • Prevent previous problem patterns • Define Problems with precision that lead to solvable problems
Using office discipline referrals as a metric for universal screening of student social behavior 6+ office discipline referrals 2-5 office discipline referrals ~5% ~15% 0-1 office discipline referral ~80% of Students
Using the Referrals by Student report as a Universal Screening Tool
Jennifer Frank, Kent McIntosh, Seth May Cumulative Mean ODRs Per Month for 325+ Elementary Schools 08-09 Cumulative Mean ODRs
Using ODRs to Identify Problems • Build a picture for the pattern of office referrals in your school. • Compare the picture with a national average • Compare the picture with previous years • Compare the picture with social standards of faculty, families, students. Goal Identify problems empirically Identify problems early Identify problems in a manner that leads to problem solving not just whining
SWIS summary 2008-2009 (Majors Only)3,410 schools; 1,737,432 students; 1,500,770 ODRs • How to use these numbers: • Your enrollment (e.g. 400 students or 225 students) • Divide by 100 (e.g. 400/100 = 4; 225/100 = 2.25 • Multiply by the National Average to get ODR per day • (4 X .34 = 1.36 2.25 X .34 = .76)
Compare with National Average 150 / 100 = 1.50 1.50 X .34 = .51 Elementary School with 150 Students
Compare with National Average 450 / 100 = 4.50 4.50 X .34 = 1.53 Elementary School with 450Students
Application Activity: Absolute Value Is there a Problem? Middle School of 625 students? Compare with national average: 625/100 = 6.25 6.25 X .85 = 5.31 Office Discipline Referrals per School Day