Evaluation of three-dimensional cloud structures in DYMECS
120 likes | 247 Views
This study evaluates three-dimensional cloud structures using the DYMECS framework, highlighting key findings from models and observations by UK Met Office researchers. It addresses questions regarding storm characteristics, including probability and factors of anvil formation, relationships between cloud top height and storm size, and the significance of ice clouds and precipitation rates. The analysis provides insights into model performance, emphasizing the need for appropriate observational data for high-resolution convective cloud evaluation and the challenges faced in accurately representing storm structures.

Evaluation of three-dimensional cloud structures in DYMECS
E N D
Presentation Transcript
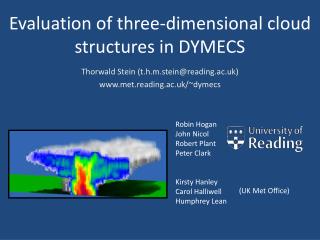
Thorwald Stein (t.h.m.stein@reading.ac.uk) www.met.reading.ac.uk/~dymecs Evaluation of three-dimensional cloud structures in DYMECS Robin Hogan John Nicol Robert Plant Peter Clark Kirsty Hanley Carol Halliwell Humphrey Lean (UK Met Office)
200-m model 1.5-km model 50-km domain 1:1 aspect ratio
What we want to know about cloud structures z What is the probability of an anviland what are typical anvil factors? How does cloud top height relate to a. Time (life time or time of day) b. Surface area 3 R 2 4 How do ice cloud reflectivitiesrelate to the precipitation rate? 1 How does the typical storm widthvary with height?
40 dBZ • 20 dBZ • 0 dBZ Storm structure from radar Radar reflectivity (dBZ) Distance north (km) Distance east (km)
1. Median equivalent radius with height – all 2012 Observed cores aredeeper (40dBZ in ice part) Observations Model storms too wide (or not enough small storms) UKV 1500m
1. Median equivalent radius with height – 25th August 2012 Convergence? Observations UKV 1500m 500m 200m Drizzle from nowhere? (see 4) ✔ “Shallow” ✖ “Deep” Lack of anvils? (see 3)
2a. Cloud top height evolution with time of day Models fail to reproducesharp increase in mediancloud top height at noon. Tallest storms (90th pct)are not deep enoughcompared to observations.
2b. Cloud top height variation with storm size Observations UKV 1500m Median height25th/75th percentile Models and observations show larger storms havehigher cloud tops. Models have too manymedium-sized stormswith low cloud tops. 200m 500m
3. Anvil probability z 6 • Define anvil as cloud above 6km with diameter larger than storm diameter at 3km. • More than 40% of storms above 6km have anvil (model and observations). 3 T=0oC R UKV 1500m Observations 200m A selection of individual profiles shows anvil factors will be small (close to 1)
3. Anvil probability z • Define anvil as cloud above 6km with diameter larger than storm diameter at 3km (500m above the melting layer). Dmax 6 3 T=0oC D PDF of anvil factor Dmax/D3km Suggests exponential distribution of anvil factors for the UK in model and observations
4. Ice cloud andprecipitation Model: High rainfall rate from storms lacking ice or have ice cloud dBZ<0 Conditioned on average reflectivity at 200-1000m below 0oC. Reflectivity distributions forprofiles with thismean Z 40-45 dBZ are shown. 1.5-km 1.5-km + graupel Observations 200-m 1.5-km new PSD
Discussion points • Are microphysics parameterisation schemes fit for high-resolution (200m or less)? • What are the appropriate regions for evaluation of convective cloud features (e.g. anvil – tropics) and do we have the observations? • What are the observational needs for high-resolution model evaluation? • Should we monitor convection for relatively rare events e.g. hail, and how (new dual-pol radars in network)? • Should a radar forward operator Z(IWC,T) adopt model assumptions on particle size distributions, or adopt a physical or empirical based approach? “is 0 dBZ really 0 dBZ”