Download

1 / 35
350 likes | 437 Views
Explore income distribution, job structures, market income trends, and energy burdens to set low-income gas rates using a sector map approach. Learn how globalization impacts local job markets and income trends for poverty analysis. Discover the Sector Map Tool for designing effective programs.

E N D
REAL ENERGY RATESUsing Energy Burden in a Sector Map Approach to Set Low-Income Gas Rates H. Gil Peach, Ph.D. – H. Gil Peach & Associates LLC Howard Reichmuth, PE Mark Thompson, M.Sc. – Forefront Economics, Inc. NCAF - 2007
Sector Map Tool • Income Donuts • Job Structure • Income Trends • Energy Burden • Sector Maps
Income Donuts • Income donut: The “income donut” shows how household income in the community is apportioned to the different families. It is a static measure for one point in time.
Income Donuts • Definition: The “Income Donut”shows what proportion of community income goes to each 20% of families.
Income Donuts • Eugene is typical of Oregon and of the US: the bottom 20% of families receives 3% of community income. • If this were a mechanical system, an engineer would never put equal stress on each sector.
Income Donuts • If this were a real donut shared by five children, we would expect more equality. • The top 5% receives 18% of community income. • The top 1.5% receives 8% of community income.
Job Structure • The “income donut” that we just reviewed reflects the underlying “job structure” of a community.
Job Structure • Poverty is produced by economic arrangements, reflected in the “job structure.” • Poverty may be influenced by individual action, but only if a structure of opportunityopens up.
Job Structure • At any one time, a community, city, state, or service territory has a “job structure.” • You can picture it as like an organization chart for a corporation…
Globalization & Centralization Effects on Local & RegionalJob Structures
Job Structure • So long as the job structure of a Service Territory does not provide enough jobs that supply a family wage, a significant portion of the families in the community will be payment troubled and in poverty. - H. Gil Peach
Job Structure - Market Income inGlobalized Markets • On the positive side, prices of goods decrease, reflecting lower cost of labor. • On the negative side, locally produced goods are replaced by goods produced overseas. As jobs disappear, so do many local businesses as, for example, big box stores replace local entrepreneurs.
Job Structure - Market Income inGlobalized Markets • The long term trend is to continually drop “job slots” from the job structure. In particular, high-level and mid-level jobs disappear. The job mix tilts towards low-level service jobs. • This both eliminates jobs and restrains wages and benefits for those who remain employed
Job Structure - Market Income inGlobalized Markets • It is now commonplace for young persons to feel that they cannot achieve the level of living of their parents. • Structurally, that perception is correct.
S ’ 1 S ’ 2 (+) D S ’ 1 3 P R P I C D E 2 ( - ) D ’ 1 G S 1 S 2 S D ’ 3 2 ( - ) QUANTITY (+) Market Determination of (Market) Income with and without Globalization. • With globalization, the local market may clear at point G, the intersection of line D2-D2’ (reduced local demand for labor) and line S3-S3’ (labor supply augmented by global labor supply).
Income Trends A good physical model of what is happening is to think back to chem lab in college or high school. -- You add something to a clear solution in a glass beaker, and after you reach a certain point of saturation, the solution stratifies and precipitates out at the bottom.
Income Trends • Use IRS numbers for what is happening to very high income – gains of several hundreds of percent in real income. • Use Census and city controller numbers for what is happening to low income households – losses of a few percent to 25% or slightly over 50% in real income.
Income Trends Where is the top of poverty? • About 150% of federal poverty level in 1992. • In 2007 -- From about 200% to 350% of official poverty. • To be conservative – it is 250%. Above that many families have sufficient income. But, depending on family structure and size WOW studies show that there are many families who are income insufficient at 350% of poverty.
Income TrendsOlder US Cities are not Doing Well (Example: Philadelphia)
ENERGY BURDEN For current energy burdens, see Roger Colton’s latest study
Roger Colton, The Home Energy Affordability Gap in Pennsylvania, April 2003
Putting it All Together • As real income declines funding of quality of life must take place outside market mechanics. • Markets have their place but when the system breaks the market can’t fix it.
Sector Map Tool The basic idea is just a graph: • Usage or a proxy for usage on the side. • Income or a proxy for income on the bottom.
Sector Map Tool • Reichmuth Sector Maps – For energy burden.
Sector Map Tool • Reichmuth Sector Map – for Affordability.
New Program Designs that Work – Example (Nevada) • Qualify: Household at or below 150% of Poverty, and a customer of at least one utility where the household pays the monthly Universal Service Charge as an adder on their bill. • Program: Each year, the total cost of gas plus electricity is set at the median energy burden for the state (about 3%). • Process: Fill out a simple form, provide income verification, and the state will send a check for the household’s last 12 months energy use (gas and electric) minus 3% of household yearly income, directly to your utilities. The household pays the rest. State Welfare offices are connected by computer to CIS at the major utilities. Processing takes about 30 days, the utility is notified immediately, so any impending termination is suspended.
Implications for Collections • Coverage – A Legal Program Logic • There are Limits to Cost-of-Service based rate designs, given what is happening to household incomes and commodity prices faced by utilities. For more and more customers, they simply do not work. • There is Need for Percentage of Income or other Alternative Design Approaches
Implication for Collections • The “Sector Map” is a useful analytic tool we have used for several utilities. Use the Sector Map tool to look at what households can pay. • Optimize: Get households to pay what they can of the cost-based bill – without trading off food, medicine, school costs for children, doctor visits. • Structure rates to recover the rest up front – ask low and moderate income customers only for what is reasonable and possible – but optimize that amount.


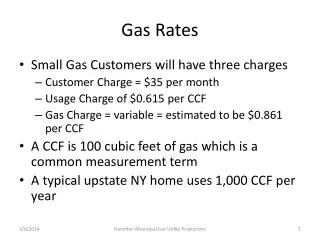


![Energy and Rates [ Thermochemistry ]](https://cdn3.slideserve.com/6636293/energy-and-rates-thermochemistry-dt.jpg)