Download
1 / 16
160 likes | 269 Views
This report highlights the challenges faced by low-income students in achieving college graduation, with only 11% nationally completing their degrees. It examines the specific graduation rates among Chicago Public School (CPS) students, notably 10% for both African American and Hispanic students, and discusses various influencing factors such as academic readiness, character strengths, college match, and affordability. The report also outlines innovative tools in college counseling and alumni coordination aimed at improving student outcomes and persistence in higher education.

E N D
Using Postsecondary Graduation rates to Improve Outcomes for Low Income Students April 24, 20013
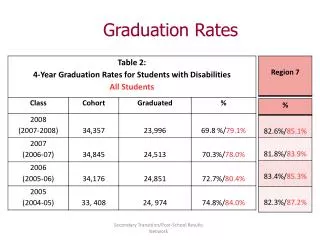
Nationally, only 11% of low income students graduate college College graduation rate for CPS 9th graders estimated to be 10% for both African American and Hispanic students (27% and 23%, respectively, of 9th graders enroll in college) Source: Mortenson, Tom. “Bachelor’s Degree Attainment by Age 24 by Family Income Quartiles, 1970 to 2010.” http://www.postsecondary.org. Underlying data sources: Current Population Survey, U.S. data for 2010 compiled with assistance of Kurt Bauman, Chief, Education and Social Stratification Branch, U.S. Census Bureau. ; Roderick, Melissa, et al. “From High School to the Future: A First Look at Chicago Public School Graduate’s College Enrollment, College Graduation, and Graduation from Four-Year Colleges.” 2006
Our results are 3x those for low income students, but lower than our aspirations 6+ years: 37% graduated (33% 4-year degrees, 4% 2-year degrees) , 9% persisting Number of alumni 80 81 98 91 73 107
Classes of 2009-2011 show persistence trends similar to prior years Number of alumni 310 102 502 Source: National Student Clearinghouse reports and Alumni Coordinator verification
Noble alumni have had 6 year bachelor’s attainment similar to the averages for the institutions they first attended Most Competitive (N=16) Very Competitive (N=44) Highly Competitive (N=26) Competitive (N=93) Less/Non Competitive (N=9) 2 year (N=47) *Analysis calculated only for those alumni matriculating directly to college in fall after high school from Classes of 2003-2006; graduations from any college count towards total shown here (this is a comparison of bachelors—including associate’s increases Noble’s total by 4%); Institution used is the first school a student matriculated to, even if multiple schools were eventually attended; 2 year colleges have half their transfer rate added to the value
Five interrelated factors have been shown to influence college persistence Academic readiness A powerful set of character strengths zest grit self-control optimism gratitude social intelligence (including self-advocacy) • The right match:student + school Social and academic integration College affordability and financial understanding
Noble’s College Team—campus driven with campus choice for structure and program • College Counseling: • 2-5 people working with 100-170 seniors • Some campuses working with juniors • Some campuses working with (some) freshmen • Some influence on advisory curriculum • Alumni Coordination: • 1 (mostly) full time person, if have alumni Right Angle Exec Dir: Works with campus coordinators to send ~25% of sophomores to summer programs (10-50% by campus) 9 campuses with seniors • Chief College Officer: • Support all college work • Provide strategic direction • Develop tools (1 with juniors, 2 with only freshmen)
College Success pipeline—definitions are first step to data clarity & transparency • College Counseling • Alumni Coordination 12th grade profile Gradua-tion • ACT • GPA/Rank • Intangibles • % Bachelor’s • % Associate’s • % Trade/job? Schools Applied to Cohort persist-ence • # of applications • Over/undermatch • Application quality • % retention • % transfer • % re-enroll Schools accepted to 1st year persist-ence • #/% accepted • Over/ undermatch • Packages • % retention • % transfer • % leave/ enroll School choice (spring) School matricul-ation (fall) • 6 yr grad rates • 1styr retention • % matriculating • % change schools
Class of 2012 proj. grad rate pipeline • Estimated potential of ~65% (if all students match), ~72% (if all reach) 12th grade profile • Highest admitted: 56% (~half match/half safety, no regard for cost or preference) • Second highest for each student:49% (average student at a safety, no regard for cost or student/family preference) Schools Applied to • 42%, average student a bit below safety Schools accepted to • 39%, 10% of students not in college School choice (spring) School matricul-ation (fall)
New tools/data for College Counseling • College Counseling • Introduced in August • Student matching exploration tool (“Robot”) • Introduced in November • Application “portfolio” tracking • Coming this month • Financial aid evaluator 12th grade profile • ACT • GPA/Rank • Intangibles Schools Applied to • # of applications • Over/undermatch • Application quality Schools accepted to • #/% accepted • Over/ undermatch • Packages School choice (spring) • 6 yr grad rates • 1styr retention
New tools/data for Alumni Coordination • Alumni Coordination • Introduced in August • New Salesforce Alumni Tracking & Support Database • Mentoring pilot (ACI) • Introduced in December • New streamlined check of National Student Clearinghouse data Gradua-tion • % Bachelor’s • % Associate’s • % Trade/job? Cohort persist-ence • % retention • % transfer • % re-enroll 1st year persist-ence • % retention • % transfer • % leave/ enroll School matricul-ation (fall) • % matriculating • % change schools
What’s next? • Continued analytic focus on college match and financial aid • Bring “Hedgehog” to college (standards and assessments for college completion) • Deepening college partnerships • City Colleges (cohort, collaboration, path plan) • ACI (mentoring ~150 with ~25 upper class alumni) • University of Illinois (all campuses) • Opportunistic (DePaul, IIT, Oberlin, Wooster) • Driving better career focus in students/alums