Download
1 / 19
190 likes | 363 Views
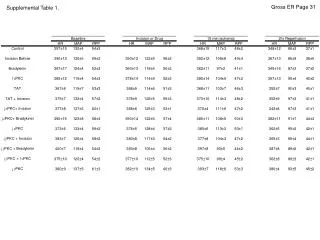
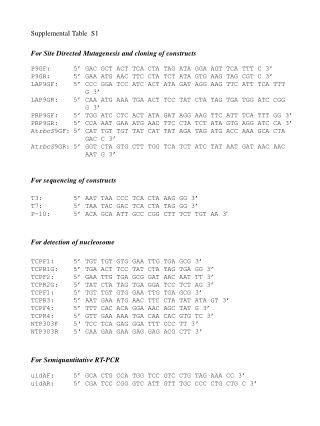
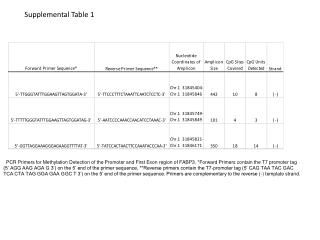
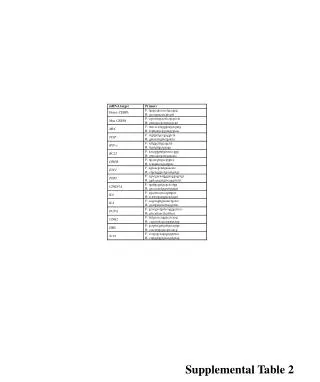
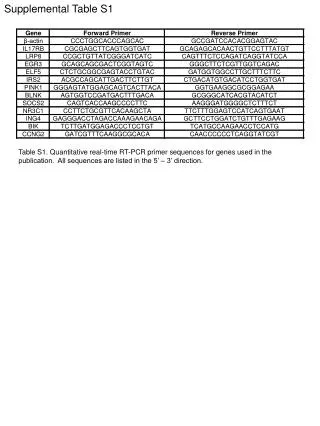
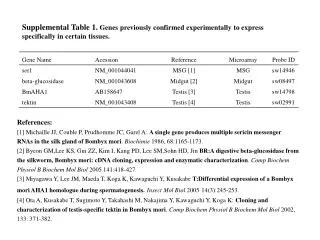
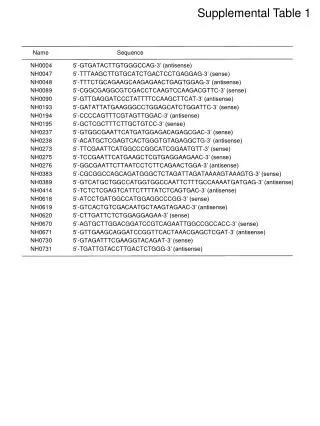
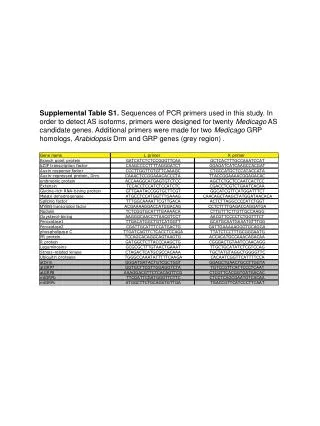
Supplemental Table S1. Sequences of PCR primers used in this study. In order to detect AS isoforms, primers were designed for twenty Medicago AS candidate genes. Additional primers were made for two Medicago GRP homologs, Arabidopsis Drm and GRP genes (grey region).

E N D
Supplemental Table S1. Sequences of PCR primers used in this study. In order to detect AS isoforms, primers were designed for twenty Medicago AS candidate genes. Additional primers were made for two Medicago GRP homologs, Arabidopsis Drm and GRP genes (grey region) .
Supplemental Table S2. Orthologous genes between Medicago and Arabidopsis showing AS in both species. Four basic AS types were indicated as AD for alternative donor, AA for alternative acceptor, ES for exon skipping, and RI for intron retention. Exon/intron structure was examined based on the number and size of exons and introns. Conserved AS genes showed same AS type in comparable exon or intron.
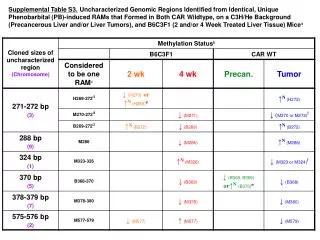
Supplemental Table S3. Orthologous genes between Medicago and rice showing AS in both species.
Supplemental Table S4. Orthologous genes between rice and Arabidopsis with AS in both species.
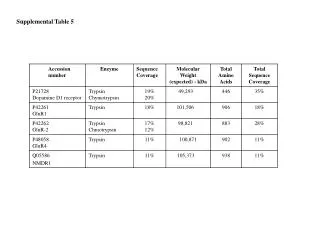
Supplemental Table S5. Orthologous genes among Medicago, Arabidopsis and rice showing AS in all species.
Supplemental Table S6. Correlation matrix of AS incidence between species and across GO categories. Values correspond to the Pearson’s correlation. coefficient.
A Arabidopsis Medicago Poplar Rice B Arabidopsis Medicago Poplar Rice Supplemental Figure S1. Sequences of exon/intron junctions at donor (A) and acceptor sites (B). Nucleotide sequences of exon/intron junctions were extracted based on the Spidey alignment. Pictograms were obtained from http://genes.mit.edu/pictogram.html using the extracted data.
Supplemental Figure S2. Sequence alignment of plant U1 snRNAs. The sequence data were collected from public databases via either publication or sequence homology search. Data from Arabidopsis, tomato, Medicago, pea, soybean, rice, and wheat were presented here. The 5’ half of the alignment was shown here and nine nucleotides conserved at the 5’-ends were indicated with a red line.
A B Supplemental Figure S3. Distribution of UA content in plant introns (A) and exons (B). Fraction of exon/intron was plotted in percentage with 10% interval of UA content.
A ATG TAA mtMYB_spliced TC101530 (AD) TC101529 (RI) ATG TAA ATG TAA B C Mt L R Supplemental Figure S4. AS of an mtMYB1 gene. (A) ORF structures of AS products. Filled boxes represent peptide coding regions and open boxes denote spliced exon regions without ORF. Lines show introns removed during splicing. Location of PCR primers were indicated as arrows. (B) Alignment of polypeptide sequences of the mtMYB1 AS products. (C) RT-PCR of the mtMYB1 from Medicago leaf and root tissues.
A B C Supplemental Figure S5. Comparison of Medicago polypeptide sequences deduced from AS isoforms of Drm (A), PR protein (B), and peroxidase (C) genes.
bps mtGRP1, TC93939 mtGRP2, TC96436 mtGRP3, TC100232 Supplemental Figure S6. Duplication of Medicago GRP genes. Three copies of the mtGRP genes were found in a BAC clone with tandem repeat (mth2-10P20, GenBank accession # ; AC134242). Diagram of the gene prediction was obtained from http://dna8.genome.ou.edu/cgi-bin/gbrowse/medicago_new. The mtGRP genes were indicated as red ovals with the corresponding TC IDs.
L R L R atGRP7 atGRP8 L R mtGRP1 L R mtGRP2 mtGRP3 L R A B Supplemental Figure S7. A. Sequence similarity of orthologous GRP gene from Arabidopsis and Medicago. Polypeptide sequences were inferred from cDNA sequences and aligned by means of the ClustalW algorithm. B.Conserved AS patterns of GRP gene homologs in Arabidopsis and Medicago. Total RNA was extracted from leaf (L) and root (R) tissues of Arabidopsis and Medicago and RT-PCR was performed with specific primer sets for each GRP gene. Three different amplicons were detected in each GRP gene from agarose gel electrophoresis. Individual band was extracted from agarose gel and verified with DNA sequencing. Phylogenetic tree was drawn with neighbor joining method using the PAUP program based on the deduced amino acid sequences.
Supplemental Figure S8. Sequence homology among MYB orthologous genes of Medicago (mt), Arabidopsis (at), and rice (os). Peptide sequences were inferred from fully spliced transcript isoforms of each gene. The matrix of sequence identities was produced by means of the ClustalW algorithm.
Figure 7. AS frequency in different GO categories. Relative abundance (RA) of TC was calculated by dividing the TC count in each category with total number of TCs. GO categories with 1% or higher abundance were used for this analysis. RA of AS genes in the categories was also obtained according to total number of AS TCs. The ratio between RA in AS genes and RA in all aligned genes was shown here as relative frequency of AS, for example, 1 for no change, >1 for more and <1 for less frequency in AS. To assess whether AS frequency was correlated with particular gene functions, all transcripts (TCs) with deduced intron-exon structures were grouped according to the GeneOntology (GO) classification system, using TC to GO mapping data available through the TIGR GeneIndex database. Only GO categories containing at least 1% of the annotated TCs in each species were considered in this analysis (Fig. 7). By way of example, for Medicago, 4,838 transcripts could associated to the 10 GO categories, including 266 transcripts represented by multiple AS isoforms. The numbers of TCs for Arabidopsis and rice that were assignable to these same 10 GO categories were 13,585 (total) and 2,797 (AS) for Arabidopsis, and 7,700 (total) and 911 (AS) for rice. Although the number of TCs varied significantly between GO categories, the relative distribution of TCs across the GO categories was similar between species (Supplemental Figure S9), suggesting that differences in AS frequency between species was unlikely to be influenced by TC distribution. Similarly, to determine whether differences in gene expression levels between species and/or GO categories might be correlated with differences in AS frequency, we plotted AS incidence as a function of the number of ESTs in each transcript (i.e., the relative in silico gene expression value). As shown in Supplemental Figure S10, AS incidence was similar across the range of inferred gene expression levels, with similar results in all 3 species. Thus, it seems unlikely that differences in gene expression would contribute significantly to differences in AS frequency, especially when AS frequency is expressed as an aggregate value for groups of genes (i.e., GO categories). The relative occurrence of AS in a particular GO category is referred to as AS bias in Figure 8, and represents the ratio of percent AS TCs in a given GO category to the percentage of total TCs in that same category. Thus, a category containing 5% of all TCs, and in which 7.5% of TCs are AS isoforms, would be overrepresented for AS and have an AS bias of 1.5 (i.e., 7.5%/5%). Values of 1 represent no bias, while values of <1 indicate under representation of AS. We observed both differences in AS frequency between GO categories, and differences between species within individual GO categories. Correlation analysis was used to compare the AS bias differences observed between species. Principal component analysis (PCA) indicates that the first 2 components explain 85% of the total variation observed in the dataset (Fig. 8). The Arabidopsis and Medicago datasets, but not rice, were highly correlated with the first principal component (PC1), while rice was correlated with PC2. These relationships are also reflected in the correlation matrix shown in Table 5, where a significant positive correlation was evident between the Arabidopsis and Medicago datasets, but neither dicot was correlated with rice. Gene ontology categories that contributed most to the variability explained by PC1 were transferase activity, membrane, and cell communication. On the other hand, cell communication and hydrolase activity, followed by development and oxidoreductase activity, were large components of the variability explained by PC2. AS bias for gene ontology categories such as nucleic acid binding and biosynthetic process were consistent with the correlation analysis, revealing differences between dicot and monocot datasets, but had a small contribution to the overall dataset variance. By contrast, AS bias was well correlated for all three species in the GO kinase activity category. Supplemental Figure S9. AS frequency in different GO categories. To assess whether AS frequency was correlated with particular gene functions, all transcripts (TCs) with deduced intron-exon structures were grouped according to the GeneOntology (GO) classification system, using TC to GO mapping data available through the TIGR GeneIndex database. Only GO categories containing at least 1% of the annotated TCs in each species were considered in this analysis. By way of example, for Medicago, 4,838 transcripts could associated to the 10 GO categories, including 266 transcripts represented by multiple AS isoforms. The numbers of TCs for Arabidopsis and rice that were assignable to these same 10 GO categories were 13,585 (total) and 2,797 (AS) for Arabidopsis, and 7,700 (total) and 911 (AS) for rice. Although the number of TCs varied significantly between GO categories, the relative distribution of TCs across the GO categories was similar between species (Supplemental Figure S9-1), suggesting that differences in AS frequency between species was unlikely to be influenced by TC distribution. Similarly, to determine whether differences in gene expression levels between species and/or GO categories might be correlated with differences in AS frequency, we plotted AS incidence as a function of the number of ESTs in each transcript (i.e., the relative in silico gene expression value). As shown in Supplemental Figure S9-2, AS incidence was similar across the range of inferred gene expression levels, with similar results in all 3 species. Thus, it seems unlikely that differences in gene expression would contribute significantly to differences in AS frequency, especially when AS frequency is expressed as an aggregate value for groups of genes (i.e., GO categories). The relative occurrence of AS in a particular GO category is referred to as AS bias, and represents the ratio of percent AS TCs in a given GO category to the percentage of total TCs in that same category. Thus, a category containing 5% of all TCs, and in which 7.5% of TCs are AS isoforms, would be overrepresented for AS and have an AS bias of 1.5 (i.e., 7.5%/5%). Values of 1 represent no bias, while values of <1 indicate under representation of AS.
Supplemental Figure S9-1. TC frequency in GO categories. In each species, the number of TC was counted from different GO groups and its percentages of total number of TC were plotted.
18,479 28,950 13,676 Supplemental Figure S9-2. Number of ESTs in TC and AS frequency. The number of TC in different EST counts were shown in bar graph and AS incidence was plotted in percentage as a function of the EST counts.
Supplemental Figure S10. We observed both differences in AS frequency between GO categories, and differences between species within individual GO categories. Correlation analysis was used to compare the AS bias differences observed between species. Principal component analysis (PCA) indicates that the first 2 components explain 85% of the total variation observed in the dataset. The Arabidopsis and Medicago datasets, but not rice, were highly correlated with the first principal component (PC1), while rice was correlated with PC2. These relationships are also reflected in the correlation matrix shown in Supplemental Table S6, where a significant positive correlation was evident between the Arabidopsis and Medicago datasets, but neither dicot was correlated with rice. Gene ontology categories that contributed most to the variability explained by PC1 were transferase activity, membrane, and cell communication. On the other hand, cell communication and hydrolase activity, followed by development and oxidoreductase activity, were large components of the variability explained by PC2. AS bias for gene ontology categories such as nucleic acid binding and biosynthetic process were consistent with the correlation analysis, revealing differences between dicot and monocot datasets, but had a small contribution to the overall dataset variance. By contrast, AS bias was well correlated for all three species in the GO kinase activity category.