Download
1 / 6
60 likes | 71 Views
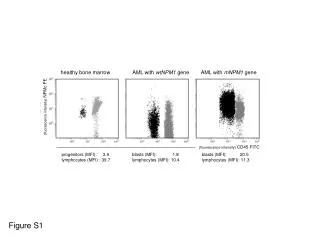
This study utilizes flow cytometry and quantitative real-time RT-PCR to characterize human multipotent adipose-derived stem cells (hMADSCs) based on cell surface markers and cytokine expressions. The findings suggest the potential of hMADSCs in tissue regeneration and repair.

E N D
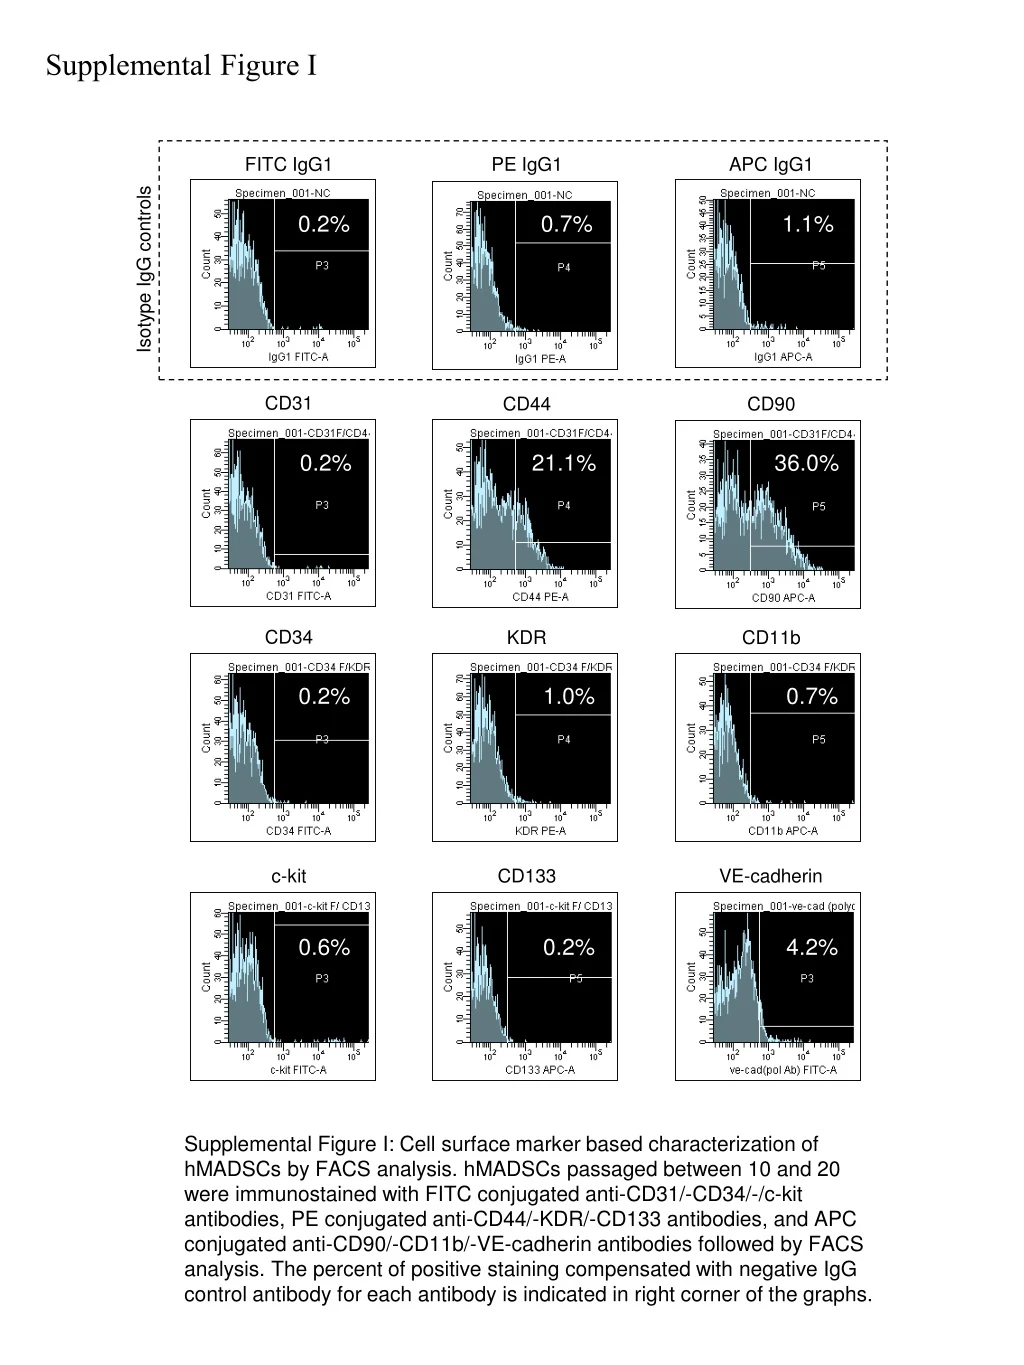
Supplemental Figure I FITC IgG1 PE IgG1 APC IgG1 0.2% 0.7% 1.1% Isotype IgG controls CD31 CD44 CD90 0.2% 21.1% 36.0% CD34 KDR CD11b 0.2% 1.0% 0.7% c-kit CD133 VE-cadherin 0.6% 0.2% 4.2% Supplemental Figure I: Cell surface marker based characterization of hMADSCs by FACS analysis. hMADSCs passaged between 10 and 20 were immunostained with FITC conjugated anti-CD31/-CD34/-/c-kit antibodies, PE conjugated anti-CD44/-KDR/-CD133 antibodies, and APC conjugated anti-CD90/-CD11b/-VE-cadherin antibodies followed by FACS analysis. The percent of positive staining compensated with negative IgG control antibody for each antibody is indicated in right corner of the graphs.
Supplemental Figure II a * * * hMADC b NS * * hMADC c * * * hMADC d * * NS hMADC
Supplemental Figure II e * * * hMADC f NS * * hMADSC Supplemental Figure II: Quantitative real-time RT-PCR analyses for cytokine expressions in hMADSCs vs. human mononuclear cells and stem cells. Cells were cultured under hypoxic conditions (5% oxygen) for 0h (normoxic condition), 8h, 16h, and 24h. The mRNA expressions of VEGF (a), bFGF (b), eNOS (c), Ang-1 (d), IGF-1 (e), and SDF-1a (f) were assessed by amplification of RNA followed by cDNA synthesis with each specific primer. Relative mRNA expressions of the indicated cytokines are normalized to that of GAPDH and presented in the graph. NS and *, P<0.05; hMADSCs (0 hr) vs. G-CSF mobilized PBMNC (peripheral blood mononuclear cell), G-CSF mobilized PB-CD34+, or CB (cord blood)-AC133+. All the assays were triplicated and demonstrated similar results in each assay.
Supplemental Figure III a Ischemic border zone TUNEL 100µm hNA Merge b cTn-I hNA Merge+DAPI Ischemic border zone hNA SMA Merge+DAPI hNA UEA-1 50µm Merge+DAPI Supplemental Figure III: Double fluorescent immunostaining for human nuclear antigen (hNA) and TUNEL, cardiomyocyte (cardiac troponin-I, cTn-I), smooth muscle cell (smooth muscle a-actin, SMA), or human endothelial cell (Ulex europaeus agglutinin-1, UEA-1) markers in ischemic myocardium 3 days (a) or 28 days (b) after surgery. hNA is indicated in red and TUNEL, cTn-I, SMA, and UEA-1 positive cells are indicated in green. The merged images of hNA and other markers (Merge) with DAPI (blue) nuclear staining (Merge+DAPI) are shown in right panels. Arrows indicate hNA positive cells. Arrowheads indicate cTn-I, SMA, and UEA-1 positive cells.
Supplemental Figure IV CD31 vWF SMa-actin SM22 hMADSC cTn-I MHCa 100µm CD31 vWF SMa-actin SM22 hCSC cTn-I MHCa 100µm Supplemental Figure IV: Transdifferentiation capacity of hMADSCs vs. human cardiac stem cells (hCSCs) in vitro. The hMADSCs and hCSCs isolated by FACS as a c-kit+ cell population from patient’s heart biopsy samples were cultured in differentiation medium (SMC D-STIM supplemented with 10ng/ml PDGF-BB, BD Biosciences) in 4-well glass chamber slide coated with 0.1% gelatin for 7 days. Cells were fixed with 4%PFA and examined by immunocytochemistry using antibodies against, von Willebrand factor (vWF, 1:50, DAKO) and CD31 (1:40, DAKO) for EC, SMa-actin (1:200, DAKO) and SM22 (1:100, Abcam) for VSMC, and cardiac troponin-I (cTn-I, 1:100, Chemicon) and myosin heavy chain a (MHCa, 1:200, Chemicon) for CM. Nuclei were stained with DAPI (blue) in all samples.
Supplemental Figure V B A C Supplemental Figure V: % of fibrosis area in LV 28 days after MI in Tie2/LacZ BMT nude mice. Mice were treated with PBS, control siRNA-hMADSCs (Ctrl siRNA), and SDF-1 siRNA-hMADSCs immediately after MI surgery. SDF-1(%) indicates the percent expression of SDF-1 mRNA in the transplanted hMADSCs. BMSC(/HPF) indicates the averaged number of recruited BMSCs in ischemic myocardium. The percent fibrosis reduction A is due to the positive effect of both hMADSC and BMSC, and when 50% of SDF-1 mRNA expression is silenced in the transplanted hMADSCs despite of the complete reverse effect of BMSC recruitment from 33/HPF in control siRNA group to 19/HPF in SDF-1 siRNA group which is the same level (20/HPF) in PBS group, the % fibrosis reduction resulted in partial inhibition (A-C=B) in SDF-1 siRNA group, suggesting that the % fibrosis reduction B is due to the positive effect of just 50% SDF-1 hMADSCs, perhaps, by direct favorable effect of remained 50% of SDF-1 production or other growth factors/cytokines produced from hMADSCson ischemic myocardium. Based on these findings, the relative contribution of hMADSCs to BMSC is considered to be B to C.