Download
1 / 20
200 likes | 233 Views
Explore why the brain becomes addicted through a deep dive into history, biology, and drug effects on brain mechanisms. Learn about dopamine system, addiction in environment and impact of drugs on receptors. Discover the brain's response to addiction.

E N D
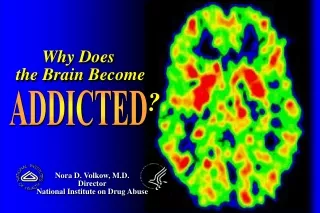
Why Does the Brain Become ? ADDICTED Nora D. Volkow, M.D. Director National Institute on Drug Abuse
HISTORY BIOLOGY DRUGS - genetics- circadian rhythms- disease states- gender - previous history- expectation- learning BRAIN MECHANISMS ADDICTION ENVIRONMENT - social interactions- stress- conditioned stimuli
Brain Dopamine System DA Transporters DA Receptors DA DA Anatomy DA DA DA DA DA signal Dopamine Cell Metabolism
Effect of Cocaine Abuse on Dopamine D2 Receptors normal subject cocaine abuser (1 month post) cocaine abuser (4 months post)
4.5 4 3.5 3 2.5 2 1.5 15 20 25 30 35 40 45 50 DA D2 Receptors in Controls and in Cocaine Abusers (NMS) Normal Controls Cocaine Abusers DA D2 Receptors (Bmax/Kd) Age (years)
Cocaine DA D2 Receptor Availability Alcohol Heroin control addicted Dopamine D2 Receptors are Lower in Addiction DA DA DA DA DA DA DA DA DA DA DA DA Reward Circuits Non-Drug Abuser DA DA DA DA DA DA Reward Circuits Drug Abuser
Biology/Genes Environment DRUG Addiction
3.2 3 2.8 2.6 Bmax/Kd 2.4 2.2 2 1.8 1.6 20 25 30 35 40 45 50 Age (years) DA D2 Receptors in Controls and Cocaine Abusers ([11C] Raclopride) Normal Controls Cocaine Abusers
3.8 3.6 3.4 3.2 3 2.8 2.6 2.4 2.2 DA D2 Receptors and Response to Intravenous MP in Controls DA D2 Receptors (Bmax/Kd) * unpleasant DA D2 receptor availability pleasant unpleasant neutral * = p < 0.004 Subjects with low receptors report MP as pleasant and those with high receptors as unpleasant pleasant pleasant
Effects of Tx with an Adenovirus Carrying a DA D2 Receptor Gene into NAc in DA D2 Receptors Overexpression of DA D2 receptors reduces alcohol self-administration 60 1st D2R Vector p < 0.0005 2nd D2R Vector 50 p < 0.0005 40 p < 0.005 p < 0.005 30 Percent Change in D2R 20 p < 0.10 10 0 Null Vector 6 10 4 8 24 0 0 -20 DA DA -40 p < 0.01 DA DA p < 0.01 % Change in Alcohol Intake DA -60 DA p < 0.001 DA -80 DA p < 0.001 p < 0.001 -100 0 4 6 8 10 24 Time (days) Source: Thanos, PK et al., J Neurochem, 78, pp. 1094-1103, 2001.
Biology/Genes Environment DRUG Addiction
Dominant Subordinate Individually Housed Group Housed 50 40 30 Reinforcers (per session) * * Dominant 20 10 0 S .003 .01 .03 .1 Cocaine (mg/kg/injection) Subordinate Morgan, D. et al. Nature Neuroscience, 5: 169-174, 2002.
What is the Functional Significance of the Decreases in DA D2 Receptors? control cocaine abuser DA DA Anatomy DA DA DA DA DA signal DA SYNAPSE Metabolism
60 55 50 45 40 Controls Abusers 60 55 50 45 40 Controls Abusers Brain Glucose Metabolism in Cocaine Abusers (n=20) and Controls (n=23) CG CG micromol/100g/min P < 0.01 OFC micromol/100g/min P < 0.005
90 80 70 60 50 40 30 2.9 3 3.1 3.2 3.3 3.4 3.5 3.6 control cocaine abuser Correlations Between D2 Receptors in Striatum and Brain Glucose Metabolism Inhibitory Control Cocaine Abusers 65 60 55 OFC 50 umol/100g/min CG 45 40 PreF Striatum r = 0.7, p < 0.001 35 30 1.8 2 2.2 2.4 2.6 2.8 3 3.2 3.4 OFC DA D2 Receptors (Ratio Index) METH Abusers Salience Attribution OFC umol/100gr/min r = 0.7, p < 0.005 DA D2 Receptors (Bmax/kd)
Would increasing DA enhance activity in the OFC? CG CA PreF Striatum PUT Would these responses differ between controls and addicted subjects? OFC nucleus accumbens VTA/SN Compared the response to IV MP (2 sequential doses of 0.5 and 0.25 mg/kg) in 15 controls and 21 cocaine abusers using FDG and PET to measure regional brain glucose metabolism
10 10 8 8 6 6 4 4 2 2 0 0 Controls Abusers Controls Abusers Self Reports of Drug Effects After MP in Controls and in Cocaine Abusers baseline First MP Second MP Self Report High Self Report Craving (0-10) (0-10) P < 0.001 P <0.001
1.30 1.25 1.20 1.15 OFC 1.10 0.3 1.05 0.2 1.00 0.1 Controls Abusers 0.0 -0.1 -0.2 -4.0 -2.0 0.0 2.0 4.0 6.0 8.0 10.0 Baseline MP MP-induced Increases in Metabolism Abusers > Controls p = 0.001 Rectal Gyrus/Brain p < 0.01 (MP - Placebo) Rectal Gyrus p < 0.005 Craving
Hipp NAcc VP Amyg Brain Circuits Involved in Drug Addiction INHIBITORY CONTROL PFC ACG OFC SCC REWARD MOTIVATION/ DRIVE MEMORY/ LEARNING Treatments Being Studied Include Those That: • Alter reward/motivational systems • Interfere with conditioned responses • Promote plasticity of dysfunctional brain circuits
ADDICTION Requires a Systems Approach DRUGS OF ABUSE social behavior neuronal circuits protein expression genome