Download
1 / 93
930 likes | 1k Views
Learn about GIS data models, representation techniques, thematic layers, attribute data types, and the difference between vector and raster models in this informative session. Understand the importance of data structures in modeling spatial database relationships.

E N D
GIS Data ModelsRepresenting the Earth Week 3 & 4 March 2 & 9 2016 Institute of Space Technology, Karachi
Data Model: Chapter 2 of Text Book Assignment 1: Read Chapter 2
Definition A data model may be defined as the objects in a spatial database plus the relationships among them (Bolstad)
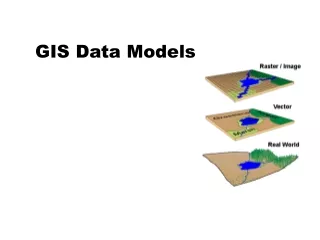
Real World Data Model GIS Data Model • An abstraction or a simplified view of the real world
GIS Data • GIS data includes information on • Spatial location • Non-spatial properties
GIS Representation • Real world entities are approximated with spatial objects or features • Entities are “things” in real world • Rivers • Roads • Land use
Objects or features are the representation of the entities in a data model • Examples • Fire Hydrant: by location points • Roads: by series of straight lines connected at nodes • Lakes: can be represented by set of polygons
Exercise: How GIS features can be extracted from this Image?
Representation of GIS Data Model Legends Buildings Land Road
What entities we may represent as Point, Line, Polygon or Surface? • Points • Buildings, fire hydrants, location of accidents, traffic signals, etc. • Lines • Roads, pipelines, rivers, water mains, traffic routes, etc. • Polygons • Land parcels, lake, countries, etc. • Surface • Elevation, temperature, spectral data
Selection of data type also depends on Map Scale Example • How to represent buildings, in a map points or polygons? • Map scale around 1:25,000 or 1:10,000 • As points • In a more detailed map of scale of 1:1000 • Buildings may better be represented as polygons, rather than point
Attribute Data Type • Qualitative • Nominal Attribute (names or labels): provide descriptive information about an object (color, landuse type, city name, etc.). • Ordinal: values assigned to objects or events represent the rank order. May be either descriptive or numeric (small, medium, large; road class I, II, III) • Quantitative (Numerical) • often recorded as real numbers, most often on a linear scale • Intervals: number that areseparated by the same interval. The "zero point" on an interval scale is arbitrary; and negative values can be used. (Temperature in oC and oF) • Ratios: have all the features of interval measurement and also have meaningful ratios between arbitrary pairs of numbers. Physical quantities like mass, length, or energy are measured on ratio scale
Representation of a feature ‘Fire Hydrant’
Thematic Layers Each layer representing a theme
Spatial Data Types – Continuous • Data is organized into surfaces where one attribute value vary across the space, examples: Elevation, temperature, rainfall, ocean salinity, etc.
GIS Data Models • Two Primary data models • Vector Data Model • Edges and vertices are defined by series of coordinate pairs (x, y) and connected by arcs • Raster Data Model • Map area is divided into grid cells • Each cell contains a value (Categorical or Quantitative values)
Data Model vs. Data Structure • A data model is a conceptual model of the real world • The representation of this model in computer is the data structure • Data models do not necessarily imply any particular data structures • Data structure is the specific format with which the data are stored on computers
Data Model vs. Data Structure • Different types of data structures can be used to represent the same data model • Example: consider a feature represented as a line (vector data model) • To draw and analyze this feature as line, computer needs some information – location of nodes/vertex • This information can be provided in the form of a table listing the coordinates of nodes/vertices and also identifying which lines goes through which node/vertices • This table is the basic data structure (coverages and shapefile use this type of structure)
Representing the Earth VECTOR RASTER
Comparison between Vector and Raster Data Models Vector • Point: Position, no area • Line: Length, no width • Polygon: Area and perimeter Raster • Point: 1 cell Line: Multiple cells joined at edges or corners, usually with only 1 or 2 neighbors Polygon: Group of contiguous cells joined at edges or corners
Vector Data Model • A vector based GIS is defined by the vectorial representation of its geographic data • In vector based model geospatial data is represented in the form of coordinates • In vector data, the basic units of spatial information are points, lines (arcs) and polygons • Composed of two components: the one that manages spatial data and the one that manages thematic data • A unique key element called ‘identifier’ for each object allows the system to connect both databases • Stores only those points which define features and all space outside these features is 'non-existent’
Some Common Vector Data Formats • Coverage • Shapefile • Geodatabase • TIN (Triangulated irregular networks)
Advantages of Vector Data Formats • Good representation of the landscape being mapped • Looks great • Generalization of the graphics is possible while still maintaining the great looks • Topology can be completely described including network linkages • ….
Raster Data Models • For Raster Model there are • Array of pixels (each pixel representing a specific value) • A matrix consisting of rows and columns with each grid or pixel representing a specific value
Raster Data Model • Raster data is an abstraction of the real world where spatial data is expressed as a matrix of cells or pixels with spatial position implicit in the ordering of the pixels • They store each cell in the matrix regardless of whether it is a feature or simply 'empty' space • Typically these cells are square and evenly spaced in the xand y directions
Cell Value • Cell values can be either positive or negative, integer, or floating point • Integer values are best used to represent categorical (discrete) data • Floating-point values to represent continuous surfaces • Cells can also have a ‘No Data’ value to represent the absence of data
Grid Size and Resolution • Pixel/cell refers to the smallest unit of information available in an image or raster map • Cell dimension specifies the length and width of the cell in surface units, e.g. the cell dimension may be specified as 30 meters on each side • volume of data increases as the cell dimension gets smaller • Reducing the cell dimension by four causes a sixteen fold increase in the number of cells • Smaller cell size provides greater spatial detail
Raster Data Model 16 m 16 m • Larger Cell Size • Lower resolution • Lower feature spatial accuracy • Faster display • Faster processing • Smaller file size • Smaller Cell Size • Higher resolution • Higher feature spatial accuracy • Slower display • Slower processing • Larger file size
Data Accuracy with Cell Mixed Pixel Problem • Value is correct when variable value is uniform over the raster cell • In case of within cell variation then average, central or most common value prevails
Types of Raster Data • Thematic Raster • Like a map describes the features and characteristics of an area and their relative position in space • Cell values are measured quantity or classification of a particular phenomenon (either integers or real numbers • Stored in a single band • Image Raster • Cell values represent reflected or emitted light/energy • Usually in 3 bands • Satellite image or scanned photographs
Raster – As Thematic Map • By grouping the values of multispectral data into classes (such as vegetation type) and assigns a categorical value