The population problem
The population problem. Social security system and education decide the reproductive behaviour of the population. To study causes & consequences of population growth and to find how population affects & gets affected by development process.

The population problem
E N D
Presentation Transcript
The population problem • Social security system and education decide the reproductive behaviour of the population. To study causes & consequences of population growth and to find how population affects & gets affected by development process
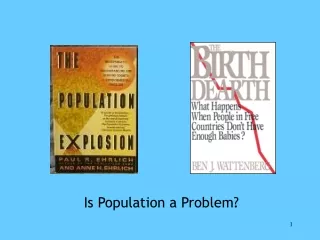
Our future depends on our choices – population is one of those • Our choices in the next 10 years will decide the speed of population growth – enormous pressure on food & environmental resources • Thomas Malthus: Population is a trap for economies are trying to develop - ⇧ in Y ⇧ in population – land fails to supply more food • David Pimentel : 1994: optimum global population – 2 billion - ⅓ of current population level - ∴ we must ⇩ population • Contrasting views by 3rd world countries – late Julian Simon: pessimists have overstated the seriousness of the problem - ⇧ is desirable
World population growth • In the beginning at 0.04% p. a. when it was 250,000,000 • Now at 1.5% p. a. and > 6 b and next 6 b will take only 50 years • In recent yrs the rate of growth ⇩ - refer p105 • some countries the rate of ⇧ substantial • India: 1.2% China: 1% • 98% of population growth between 1998-2025 will be in poorer countries
Population growth • Age structure is important – no. of people in child bearing age & no. of children those people are bearing • Replacement rate – once reached takes 25 years for population to stabilize. During 1991 – 2001 growth rate in Europe < 0.5%, China 1.1%, Sri Lanka 1.3%, India 1.9% • How population growth affects sustainability? How can population growth be altered when it is appropriate?
Population growth affects economic growth • When marginal product is < average product, adding more persons ⇩ welfare of average citizen • Total output: O = L × X • Per capita output = O ∕ P = (L ∕ P) × X • Population in labour force & output per worker decide the way the population growth affects the growth • Population with higher growth rate has higher % of younger persons– slow growth older population
Youth effect: abundance of youth – large supply of young population too young to work • Retirement effect: slow population growth – many in 60+ group • Many developing countries experience both simultaneously as public heath facilities DR • How Y and RE interact to determine the % of population in labour force? • Female availability effect: a few children & slower rate of growth of population – more women available
Connection between population growth & capital accumulation – CA enhances productivity – Relation between population & CA – age structure important – old save more - rapidly growing population ⇩ savings ⇩ Investment – low productivity • Negative effect of population growth on economic development – due to limited supply of land & raw material • ∴ addition of variable factor to some fixed factors, will bring in Diminishing Marginal Productivity ∴ PCI falls with in population • Population growth can enhance per capita growth due to technological progress & economies of scale
Labour employed on fixed amount of land • Pt1 : functional relationship between MP of labour & no. of labour employed on fixed land at the time period t1 As time passes technological progress is more with rise in population viz. Pt2 & Pt3 With Lt1 labour, MP is Mt1 At Lt2 & Lt3 it is Mt2 & Mt3 • More labour will result in higher MP • If technology was not to improve then Lt2 & Lt3 will result in (with Pt1) A & B ∴ Diminishing marginal productivity • Thus technical progress escape from DMP
2nd source of in output per worker is economies of scale increasing returns • ⇧ in population more demand large scale production - Today: Global trade LS production • There is no strong correlation between population ⇧ & growth in PCI • National Research Council (1986): tried to find evidence - generally, no strong correlation - found that: • Slower popu ⇧⇧ capital per worker ∴ ⇧ productivity • Slower popu growth - unlikely to result in reduction in agri productivity & may raise it • Density of popu & economies of scale are not related • Rapid popu growth puts more pressure on resources, depletable & renewable
In 1980s negative effect of popu growth seen for the first time • Kelley & Schmidt: -ve impact of demographic change ⇩ with the level of eco development – larger impact in relatively poor countries – those who need to have ⇧ in their std of living are more adversely affected by population⇧ • ⇧ in population → ⇧ income inequality - gap between rich & poor ⇧ - Higher fertility affects the size (⇧) & quality (⇩)of labour force • ∴ Controlling population is important as slower population growth ⇩ income inequality as it improves education & health levels of children – powerful motivation to control population
Increase in supply Of labour Increasing population Effects of increasing population Fall in wages Increase in profit Increase in inequality
Population & Environment • ⇧ population environmental degradation • ⇧ density poverty • ⇩ forest lands as trees are cut down - keeping fallow land (7 years) not possible • Land : man ratio declines as supply of land is fixed Use of marginal land with low fertility - Intensive cultivation - subdivision - fragmentation tiny holdings • Erosion of land, especially of marginal land - ∴ degradation of land • Pressure on land in India– of rising demand for apartments & of reducing availability of water for farmland – selling land to builders – further less production
Effects of economic development on population growth • Theory of demographic transition :stage I: ⇧ in population, stage II: rapid rise in population, stage III: ⇧ life expectancy • HIV & AIDS changed this theory in sub-Saharan Africa – pandemic of AIDS – SAARS – now new: H1N1 • The theory is useful in countries where DR has ⇩ because reduction in population growth accompanies ⇧ std of living in the long run
Why BR falls in the long run? • Can the fall in BR be hastened? • Will the lower income countries automatically experience demographic transition as standard of living improves? • Can industrialisation or better agricultural production systems give any solutions to ‘the population problem’? • Many questions unanswered: To find answers to these we need to look deeper into the sources of change that create demographic transition. Once identified, they can be manipulated to produce maximum social benefit.
The Economic approach topopulation control • Is current rate of population growth efficient & sustainable? • When popu growth in ↓ in PCI – not sufficient to prove that inefficiency exists • When ↓ output is borne by the families with children it is conscious decision by the parents to sacrifice production to have more children – net benefit from having children > net benefit lost as output per person declined
Do parents always make effective child -bearing decisions? “No” for 3 reasons: • These decisions impose external costs outside – transport, gardens, books… • Prices of services related to child-bearing are inefficient ∴ sending wrong signals • Parents are not aware of birth-control methods or may not have access to those
‘congestion externalities’ – cost intensified when free access for common property – using resources at higher than optimal capacity • 2. High population growth intensifies income inequality - Income inequality is a public good • 3. People like to have better equality because (i) humane approach (ii) inequality tension in the society – less pleasant to life - charitable institutions to reduce inequality Two sources of market failure can be identified : Parents don’t think of externalities when they think of having children – theirdecisionsoptimal for individuals but inefficiently large population
Low cost of food & education will boost population rise – in developing countries food subsidised – education free / subsidised – ∴ marginal cost of having a child is little • School/education taxes same irrespective of no. of children • Social cost of educating a child > additional cost of education of a child – cost to parents is not sensitive to number of children • Many cultures – right to bear children – India – dictating the size of family - election lost • Failure to control family size devastating to quality of life
Democracy & control? Flexibility to families in choosing their family size and gaining control over population growth? • Successful population involves: • Lowering desired size of the family • Providing sufficient access to contraception & family planning • Identify the factors that affect & change the reasons to have more children
Micro-economic theory of fertility • Children are like commodities, higher the cost of bringing them up less are they desired. Marginal benefit & cost - € per child MB1 MC2 MC1 MB2 O No. of children Q4 Q3 Q4 Q1
In agricultural sector children work on farms – but in industries no contribution – child labour laws ∴ low demand for children • Children for old age – when other ways are open benefit from additional child falls – PF, pension.. • Woman’s status depends on no. of children she bears ∴ benefit from additional child – Now? • ⇩ in infant mortality ⇩ in no. of births • How ⇧ employment is shared among members of the society - fertility declines in spite of low PCI - with relatively equal distribution of Y + widespread participation in the benefits of growth -Dramatic fall in fertility in Korea during 1960 -74 • Why MB - demand curve shifts inward?
Cost of children too decides family size • ∴ change MC as a means of controlling the population • Main component is opportunity cost of mother’s time – women’s entry into labour market ⇧ it – higher marriage age – less no. of children • Housing space is more expensive in urban areas • Cost of education -children in school than working • More & higher quality of education for children
It is found that: • Richer the family higher the education & better health care • Rise in the value of mother’s time has +ve effect on demand for contraceptive services & -ve effect on fertility • Rise in the value of father’s earnings has +ve effect on completed family size, child health, education • Increase in mother’s schooling has –ve effect on fertility & infant mortality & +ve effect on nutrition & children’s schooling
To empower women • Effective methods of controlling the population • Through It in human capital (education & training) or physical capital (machinery etc.) • Collateral? - no own property – opportunities lost • Bangladesh – innovative solution • Better income better population control, especially in third world – for both rich & poor • Women are at the centre of process of change as mothers, producers, suppliers of food - fuel - water, traders etc • Desire to ⇩ size of the family - not enough to access birth control information • Access to means of family control + better education + employment opportunities = better result
Finally, • World population growth has slowed • Enter into ‘zero population’ growth • Fall in population – less ss of labour – rise in average age – PCI of family rises • Lower population growth Y-inequalities • Low SS of labour higher wages • Plays significant role in maintaining sustainability • Smaller population has better share of growth advantages