The Impact of Internet Resource Sharing Protocols on Microeconomics: Bridging Theory and Practice
1.27k likes | 1.36k Views
This resource explores the gap between theoretical ideals and practical challenges in sharing Internet resources. It delves into TCP-friendliness, bandwidth allocation, user behaviors, and the implications for network operators and users. The discussion covers the evolution of sharing protocols, network capacity dynamics, and the complexities of balancing freedom with accountability in a shared Internet landscape.

The Impact of Internet Resource Sharing Protocols on Microeconomics: Bridging Theory and Practice
E N D
Presentation Transcript
practical microeconomicsand Internet resource sharing protocols Bob Briscoe Sep 2009 “The gap between theory and practice is greater in practice than in theory” Steve Crocker
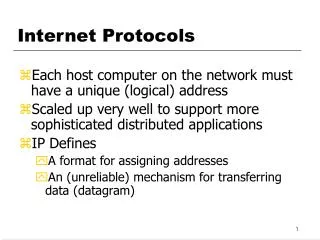
how to share a packet network? • anyone can use any capacity anywhere on the Internet, as much as they like, without asking • fantastic ideal • but when freedoms collide, what share do you get? • freedom with accountability • decades of misunderstanding to undo • need solutions that cater for • self-interest & malice • of users and of providers • without killing cooperation • evolvability • of new rate dynamics from apps • of new business models • viability of supply chain • simplicity (e.g. one-way datagrams) Internet topology visualization produced by Walrus (Courtesy of Young Hyun, CAIDA) 2
unresponsive flow3 how Internet sharing ‘works’TCP-friendliness • endemic congestion • voluntarily restraint by algorithms in endpoints a game of chicken – taking all and holding your ground pays or start more ‘TCP-friendly’ flows than anyone else (Web: x2, p2p: x5-100) or much more data (for longer) than anyone else (p2p file-sharing x200) • net effect of both (p2p: x1,000-20,000 higher traffic intensity) capacity bandwidth2 bandwidth1 time (VoIP, VoD)
TCP's broken resource sharingbase example: different activity factors rate time flowactivity 2Mbps access each 80 users ofattended apps 20 users of unattended apps 10Mbps
80 users of attended apps 20 users of unattended apps 2Mbps access each TCP's broken resource sharingcompounding activity factor & multiple flows rate time flowactivity 10Mbps
before afterupgrade most users hardly benefitfrom bottleneck upgrade data limited flowswant rate more than volume rate time flowactivity 80 users of attended apps still 2Mbps access each 20 users of unattended apps 1040Mbps all expect 30M/100 = 300k morebut most only get 60k more
if those willing to spend more can’t get more, they won’t spend more then we all share a smaller Internet recall but ISP needs everyone to pay for 300k more if most users unhappy with ISP A’s upgrade they will drift to ISP B who doesn’t invest competitive ISPs will stop investing... 1040Mbps consequence #1higher investment risk all expect 30M/100 = 300k morebut most only get 60k more
consequence #2trend towards bulk enforcement • as access rates increase • attended apps leave access unused more of the time • anyone might as well fill the rest of their own access capacity • operator choices: • either continue to provision sufficiently excessive shared capacity • or enforce usage limits see joint industry/academia (MIT) white paper “Broadband Incentives” [BBincent06]
consequence #3networks making choices for users • characterisation as two user communities over-simplistic • heavy users mix heavy and light usage • ISP sees two prioritisation choices • bulk: network throttles all a heavy user’s traffic indiscriminately • should encourage the user to self-throttle least valued traffic • but many users have neither the software nor the expertise • selective:network infers what the user would do • using deep packet inspection (DPI) and/or addresses to identify apps • even if DPI intentions honourable • confusable with attempts to discriminate against certain apps • user’s priorities are task-specific, not app-specific • customers understandably get upset when ISP guesses wrongly
ISP’s homespun alternativeshave silently overridden TCP bit-rate who is the fairest of them all? • equal bottleneck flow rates(TCP, XCP, RCP)? • access rate shared between active users, but weighted by fee (WFQ)? • volume capstiered by fee? • heaviest applications of heaviest usersthrottled at peak times by deep packet inspection (DPI)? time bit-rate time bit-rate time bit-rate 10 time
none of the aboveharness end-system flexibility source: Ellacoya 2007(now Arbor Networks) bit-rate 1. TCP XCP RCP • light usage can go much faster • hardly affects completion time of heavy usage NOTE: weighted sharing doesn't imply differentiated network service • just weighted aggressiveness of end-system's rate response to congestion, e.g. [LEDBAT] bit-rate weightedTCPsharing time bit-rate time 2. (weighted) fairqueuing congestion time bit-rate 3. volume caps time time bit-rate 4. deeppacketinspection(DPI) time
two arbitrary approaches fighting bit-rate bit-rate • each cancels out the worst failings of the other • Internet looks like 'it works OK' • but the resulting arms race leaves collateral damage time throttling heavy volume usage 'flow-rate equality'
very large sums involvedvery large distortions involved • definition of 'premium' • services requiring better than normal QoS (latency or b/w) • not necessarily using network QoS mechanisms (e.g. VoIP) Sources: Analysys Research (2005) and S Rudkin, BT internal report (Oct 2005)
in which fields of knowledgeshould we look for solutions? • philosophy • economics • microeconomics • political economy • industrial organisation • engineering • data networking • control theory • computer science • information theory • mathematics 11 layer OSI stack
philosophyfairness / justice • 350 BCE Aristotle distinguished: • distributive justice • is the overall distribution of resources fair? (centralised) • commutative (rectifactory) justice • is each redistributive transaction fair? (distributed) • if voluntary, yes, by definition • proposed approach • microeconomics for globally distributed resource sharing • in the process, we must sort out correct metrics, incentives, etc • invent technology to mitigate failings of market mechanisms • groups can override market allocations amongst themselves • e.g. country, university, multinational business, consortium, NATO, club, Internet café, ISP
organisation of lecture • the problem: how to share a packet network? • in theory – use a market mechanism • in practice – failings of market mechanisms • technical fixes for the failings of markets? • fallacies • specifics
terminological exactitude • tariff • e.g. where V is volume [B] & t is time [month] • charge, G = aV + bt + c • price • undefined unless wrt to something price wrt V • cost • undefined unless state to whom cost to consumer = charge levied by producer cost to producer
consumersurplus providerrevenue consumer value the point of all this economics consumersurplus cost to consumer= provider revenue providerprofit provider cost over time a competitive market is meant to • ensure resources get allocated most to those willing to pay most for them • provide the funds to invest where supply is short of demand • reduce the cost of what consumers buy to the cost of providing it • a) & b) operate within a market (e.g. Internet usage) and between markets (e.g. Internet vs. travel vs. wine) • c) squeezes profits and grows consumer surplus • a) should ensure everyone optimises their utility (happiness) given their limited wealth and that they must cover the cost of the things they want time utility of wine /€ net utility /€ = utility – charge charge for wine /€ wine /lt wine /lt
the invisible hand of the marketoften needs a helping hand • if you don’t want the rich to pay more & get more (a), don’t use a market • but market is simplest distributed way to optimise utility (a) & match supply to demand (b) • so governments typically prefer to give pensioners €10/month to spend freely, rather than a €10 Internet voucher • a poorly competitive market won’t squeeze profits (c) well • governments often prefer to regulate an uncompetitive market, e.g. by capping prices close to the cost to the provider (as if c) • then utility optimisation (a) & matching supply to demand (b) can still proceed automagically
cost vs value in Internet architecture • user value per bit varies over ~1010 (video vs SMS) • not role of network architecture to reveal user value • revealing cost (to consumer) is role of architecture • lowest cost routes (without traffic) • traffic cost • then net can make user accountable for cost of actions • user decides if private value of act is worth the cost • harder as cost to consumer approaches true cost • dynamic cost of traffic congestion • allocating traffic costs between networks
relaxing the economics • don’t confuse being able to hold users accountable for true costs with a desire that every ISP should • as long as ISPs can put in constraints, they can also relax them • as market gets more competitive, ISPs need to be able to tend towards true cost • architecture must be able to allow tussle between profit & consumer surplus to play out • reference: “Tussle in Cyberspace” [Clark05]
gi slope p q xi usage vs subscription prices Pricing Congestible Network Resources [MacKieVarian95] • assume competitive providers buy capacity K [b/s] at cost rate [€/s] of c(K) • assume they offer a dual tariff to customer i • subscription price q [€/s] • usage price p [€/b] for usage xi [b/s], then charge rate [€/s], gi = q + pxi • what’s the most competitive choice of p & q? • where e is elasticity of scale • if charge less for usage and more for subscription,quality will be worse than competitors • if charge more for usage and less for subscription,utilisation will be poorer than competitors c K average cost marginal cost c K
for example • if a 10Gb/s link costs €1000 • and it costs €67 to upgrade to 11Gb/s • average cost = €100 per Gb/s • marginal cost ~ €67 per Gb/s • ie usage revenue covers marginal cost subscription revenue covers the rest average cost marginal cost c K
free-riding problems tragedy of the commons problems typology of goods • shared Internet bandwidth: a common good • ‘use-up-able’ and non-excludable (if ‘pure’ Internet) • also instantly perishable (the extreme of non-durable goods) • free-riding typically reduces the incentive to supply • common goods tend to be under-supplied and over-consumed • network congestion = too much traffic meets too little capacity • public (e.g. Wikipedia) easier than common goods for creating a sharing economy
externalities • an externality occurs where the actions of one agent directly affect the environment of another agent • reference: Varian, Microeconomic Analysis • positive externalities • others use software compatible with yours • others connect to your network (‘network effects’) • negative externalities • pollution, road congestion, network congestion
aligning incentivesin the presence of externalities • a market doesn’t ‘work’ if externalities present • when deciding how much gas to use, homo economicus only takes account of the cost to him, not to others • solution: internalise the externality • increase his charge by the cost to others of his actions • he will use less gas – the correct amount to optimise everyone’s utility (a) and match supply to demand (b)
dual view of congestion harm metric bit rate x1(t) user1 user2 • what each user i got, weighted by congestion at the time • bit rate [bs-1] weighted by congestion [] • the bits each user contributed to excess load • congestion weighted by each user’s bit-rate pj(t)xr(t) • a precise instantaneous measure of harm during dynamicsthat easily integrates over time and sums over the resources j on the route r of a flow and over allthe flows of a user i, where pr = jr pj viri pr(t)xr(t) dt • termed congestion-volume [byte] • result is easy to measure and compare per user • volume of bytes discarded or ECN marked • intuition: compare with volume, Viri xr(t) dtwhichis bit rate over time summed over all a sender’s flows • network operators often count volume only over peak period • as if p(t)=1 during peak and p(t)=0 otherwise x2(t) loss (marking) fraction pj(t)
note: diagram is conceptual congestion volume would be accumulated over time capital cost of equipment would be depreciated over time dual demand & supply role ofcongestion-volume metric • a resource accountability metric • of customers to ISPs (too much traffic) • and ISPs to customers (too little capacity) • cost to other users of my traffic • the marginal cost of upgrading equipment • so it wouldn’t have been congested • so my behaviour wouldn’t have affected others • competitive market matches 1 & 2 NOTE: congestion volume isn’t an extra cost • part of the flat charge we already pay • we might see tiered pricing like this...
congestion-volume bit-rate 1. TCP XCP RCP • takes into account all three factors • bit-rate • weighted by congestion • activity over time bit-rate weightedTCPsharing time bit-rate time 2. (weighted) fairqueuing congestion time bit-rate 3. volume caps time time bit-rate 4. deeppacketinspection(DPI) time
volume rate congestion-volume WARNING: Requires validationwith more sample data 'Cost': Congestion-Volume: Total TCP Loss [Byte] 100% 10% 1% Initial results measured over 2 hrs on Naples Uni net Each point is a user correlation coefficient: 0.43 0.1% 0.01% average congestion fraction 0.001% Volume: Total TCP Traffic Volume [Byte]
sneak preview:flat fee, best without effort QoSif ingress net could see congestion... Acceptable Use Policy 'congestion-volume' allowance: 1GB/month @ £15/month Allows ~70GB per day of data in typical conditions • simple invisible QoS mechanism • ECN & AQM keep delay & loss tiny • apps that need more bit-rate just go faster • only throttles congestion-causing traffic when your contribution to congestion in the cloud exceeds your allowance Internet 0% bulkcongestionpolicer 0.3%congestion 2 Mb/s0.3Mb/s6 Mb/s 0.1% ...but it can't • the Internet wasn't designed this way • path congestion only visible to end-points,not to network
utility (value) wrt bit rate: curve families inelastic(streamingmedia) elastic(streaming) pre-1995model value€/s value€/s value€/s video Web? theoretical[Shenker95] & actual value models audio bit rate bit rate bit rate • reasonable assumption used throughout economics: utility satiates (concave): • slope (marginal utility) monotonically decreases • utility monotonically increases average of normalised curves from a set of experiments on paying customers [Hands02]
charge = px utility customersurplus increasingprice, p [€/b] networkrevenue bit rate, x net value = value – charge[€/s] net value bit rate bit rate value – charge: consumer’s optimisation utility[€/s] charge = px[€/s] congestion- volume bit rate, xb/s
varyingprice congestion charging n probability drop 1 mark ave queue length n • volume charging • but only of marked packets n n n n n value charge bit rate accesscapacity bit rate accesscapacity (shadow)price bit rate (shadow) price
(shadow)price = ECN n probability drop n networkalgorithm supply 1 s senderalgorithms demand mark ave queue length maximises social welfare across whole Internet [Kelly98, Gibbens99] DIY QoS target rate n inelastic(audio) n n n s n n (shadow) price n target rate s ultra-elastic(p2p) s target rate TCP (shadow) price (shadow) price
familiar?– how Internet congestion control ‘works’ now target rate n n TCP n n s n n (shadow) price n n probability 1 drop ave queue length target rate s s target rate TCP • ~90% of Internet traffic (TCP) works this way already, but • dropping not marking • senders respond voluntarilyas if congestion charged • no accumulation over time or flows • every sender responds identically TCP (shadow) price (shadow) price
microeconomics or ‘just’ optimisation? • some use a ‘price’ purely as a name for a slack variable introduced in order to solve a distributed optimisation problem • microeconomics solves a distributed optimisation problem • some choose to connect a technical optimisation to the real economy through applying market prices • others don’t • for instance, today’s TCP uses losses as a ‘price’ • although no-one applies market prices to TCP losses • there are numerous connections between TCP and the Internet market within which it exists • an optimisation can choose to optimise anything • comparing an optimisation to real-world economics can hilite bad choices
reverse engineering TCP’s economics(rough model) as if derived from a utility curve • window of W packets per round trip time T
reverse engineering TCP’s economics(rough model) as if derived from a utility curve • TCP packet rate is more sensitive to RTT than bandwidth K utility RTT bit-rate, x
asideutility: ordinal not cardinal value charge • utility itself never actually needed • endpoint algo solely maps congestion to bit-rate • no change if utility curve shifted up or down • only slope (marginal utility) is ever used bit rate (shadow)price bit rate
bit-rate ‘good enough’ or optimal? TCPXCPRCP time bit-rate • optimisation can be oversold • in life ‘good enough’ is everywhere • history gets stuck down paths that end at good enough • to jolt onto better path higher effort than value gained • but highly sub-optimal outcomes cause distortions • if architecture leads to extreme suboptimum (e.g. TCP) • economics will win another way (e.g. deep pkt inspection) • architecture that prevents tussle (optimisation) gets violated • result: a mess • see “Tussle in Cyberspace” [Clark05] bit-rate bit-rate weightedTCPsharing DPI time time
the idea that humans want to have a known fixed bit-rate comes from the needsof media delivery technology hardly ever a human need or desire services want freedom & flexibility access to a large shared pool, not a pipe when freedoms collide, congestion results many services can adapt to congestion shift around resource pool in time/space Constant Bit Rate 100% Constant Quality 125% sequences encoded at same average of 500kb/s constant quality video encoding motivating congestion-volumeharnessing flexibilityguaranteed bit-rate?or much faster 99.9% of the time? bit rate time % figures =no. of videosthat fit into the same capacity Equitable Quality 216%[Crabtree09]
market failures the Internet suffers from them all!
externalities (-) congestion (+) network effects non-excludability market power natural monopoly switching costs transaction costs 2-sided market termination monopoly information asymmetry the bit-rates people choose will be ‘wrong’ global utility won’t be maximised supply won’t match demand profit won’t be squeezed technical fix(es)? more helping hands for the invisible hand? market failuresthe Internet suffers from them all!
not too perfect, please! • Internet can’t be isolated from the economy • driving charges to cost and other benefits (a,b,c) can’t happen if market can’t function well for technical reasons, e.g. • true cost information only visible asymmetrically • high barriers to entry for new providers • high costs for customers to switch providers • but, if Internet market is too ‘efficient’ • investment will go to less ‘efficient’ markets i.e. with higher profitability
natural monopoly of access networks C 1 B bandwidth cost, C €/bps • geographical coverage • two operators each build networks covering an area • if they each get half the customers spread evenly • costs nearly twice as much per customer • solutions are primarily regulatory • a ‘layer 2 problem’ necessary to correct at L2 • e.g. ‘local loop unbundling’ • monopolist must lease out copper lines and equipment space in exchange • at regulated price and quality, incl. installation time, access to building, etc 0 0 aggregate pipe bandwidth, B /bps NB NA R1 ND S1
switching costs(switching in the economic sense) • consumer cost of switching between providers • identifier portability (e.g. email, IP address) • reconfiguration of stored profiles, data etc • contractual lock-in (e.g. 1yr min contract) • regulatory remedies • technical remedies: • simultaneous contracts • multihoming • multipath TCP
communications: a 2-sided market the direction of value flow
who to make accountable for usage costs?sending net (content)? rcving net (eyeballs)? • if use principle of cost causation, sender pays • safe against denial of funds (DoF) • xmt value /leg = Uj • if sender pays and Us < cost, no transmission,even if Uj >> cost • two-sided market (cf. credit card, night club, auction) i info value U = f(i, place , time ) i xmt value Us = f(i, a1 , t2 ) - f(i, a1 , t1 ) Ur2
U : utility (to consumer) s/r : sender/receiver subscript C : cost (to provider) X : charge (paid by consumer) S = U-X : consumer surplus P = X-C : provider profit Ct : apportionment transaction cost charge frontier represents apportionment choices shaded region is provider’s upper bound cost frontier is provider’s lower bound odd discontinuities due to apportionment transaction cost market evolution max provider profit, P* immature market commoditised market max consumer surplus, Ss4+Sr4 as market commoditises, need for retail apportionment reduces (‘bill and keep’ becomes predominant) charge apportionment sndr Ur Sr2 Ss4 Ss3 Ss2 Us 1 3 P3 Ct C 2 4 X X* rcvr P2 Sr3, Sr4 P*