Download

1 / 20
210 likes | 342 Views
Comparison of Discharge Measurements Made Using the ADCP and Price Current Meters. David S. Mueller U.S. Geological Survey Office of Surface Water. Overview. Purpose of Validation Instrument Check Laboratory Tests Specialty Tests Field Validation Cup meter – ADCP method comparison

E N D
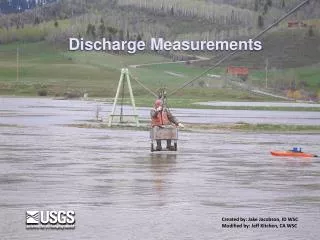
Comparison of Discharge Measurements Made Using the ADCP and Price Current Meters David S. Mueller U.S. Geological Survey Office of Surface Water
Overview • Purpose of Validation • Instrument Check • Laboratory Tests • Specialty Tests • Field Validation • Cup meter – ADCP method comparison • Collecting comparison measurements • Results to date • Ongoing Work • Summary and Conclusions
Purpose of Validation • Assess accuracy • Requires knowledge of the true value • What is the true discharge? • Assess repeatability • Measurements • Instruments • Data consistency and limitations • Instruments (Acoustic, Mechanical, etc.) • Users • Field conditions
Laboratory Tests • Advantages • Controlled conditions • Traceable to standards • Isolate specific conditions • Repeatable experiments • Disadvantages • Acoustic and magnetic interference • Tow tank tests lack turbulence • Backscatter material must be added • Backscatter uniformity • Flowing water – no traceable standard
Specialty Tests • Beam Alignment Test • Compare GPS to BT distance made good • Acceptable ratio: 1.003 to 0.995 • GPS vs BT discharges • Compared where no moving bed • Tests compass and bottom track • GPS vs BT ship tracks • Lag in GPS data
Field Validation • Advantages • Real conditions • Turbulent flow • Irregular bed • Difficulties • Need variety of conditions • Time consuming • Repeatability / steady flow ??? • What is the reference discharge? • Price meter or Rating
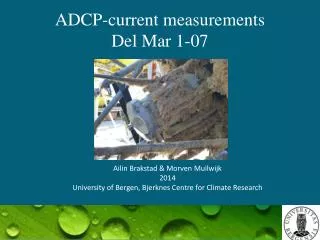
` Difference in Methods • AA meter • Measures water speed • Direction assigned by user • Discrete point measurements • Velocity profile assumed • ADCP • Measures 3-D velocity • Profile measurements • Velocity profile extrapolated at top and bottom • Continuous measurement across stream • Large spatial sampling area
Broadband Comparisons Morlock, S.E., 1996, Evaluation of acoustic Doppler current profiler measurements of river discharge, USGS WRIR 95-4218. • 12 gaging stations • 9 states • 31 ADCP measurements • Reference • Primarily stable ratings • Adjusted ratings • 7 current-meter measurements to validate or adjust ratings • Characteristics • Width: 140 – 3,600 ft • Mean Depth: 5 – 25 ft • Mean Velocity: 0.7 – 3.8 ft/s • Discharge: 758 – 59,800 cfs • Results • 26 within 5% of reference • All within 8% of reference
Initial Rio Grande Comparisons Mueller, D.S., 2002, Field assessment of acoustic-Doppler based discharge measurements in ASCE Hydraulic Measurements and Experimental Methods 2002.
Reference Discharge • Simultaneous measurements • Sequential ADCP and reference measurement • Accurate gate, weir, or hydropower ratings • Stable accurate stage-discharge ratings
International Cooperation • U.S. Geological Survey • Environment Canada • Swedish Meterologic and Hydrologic Institute (SMHI) • Norwegian Water Resources and Energy Directorate (NVE) • RijkswaterstaatOost – Netherlands
Rio Grande Validation Oberg, K.A., and Mueller, D.S., 2007, Validation of streamflow measurements made with acoustic Doppler current profilers, ASCE Journal of Hydraulic Engineering, Vol. 133, No. 12, December 2007, p. 1421-1432
Plots of Reference Q vs ADCP Q Mode 12 Mode 5/11 Mode 1 t-Test p=0.41 t-Test p=0.75 t-Test p=0.85
Ongoing Comparison • TRDI Rio Grande • Mode 12 vs Mode 5/11 • TRDI Streampro • Shallow water system • TRDI RiverRay (NEW!) • 600 kHz phased array • SonTek/YSI RiverSurveyor (NEW!) • M9 – 3 frequencies (1, 3, 0.5 MHz) • M5 – 2 frequencies(1, 3 MHz)
Measurement Duration Analysis Duration = Total time spent sampling
Summary and Conclusions • Comparison of discharge measurement instruments and methods is important to maintain data consistency • Laboratory test while valuable are limited • Field comparisons are important for instrument and methods comparisons • Field have shown that ADCP and Price AA methods: • Produce similar discharges • Display little to no bias • Continued field comparison are necessary • New instruments • Range of conditions