Download
1 / 30
910 likes | 1.83k Views
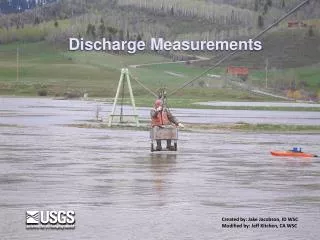
Discharge Measurements. Created by: Jake Jacobson, ID WSC Modified by: Jeff Kitchen, CA WSC. Site Selection. The channel should be straight and uniform for a distance long enough to support uniform flow. Measurement Section. Control. Flow. Riffle. W. 5W. 2W.

E N D
Discharge Measurements Created by: Jake Jacobson, ID WSC Modified by: Jeff Kitchen, CA WSC
Site Selection The channel should be straight and uniform for a distance long enough to support uniform flow. Measurement Section Control Flow Riffle W 5W 2W
This measuring section at the Snake River near Moran is ideal.
Measuring Discharge Teton River above South Leigh Creek nr Driggs, ID Snake River at Flagg Ranch, WY Wading Bridgeboard
Measuring Discharge Pacific Creek at Moran, WY Ice Snake River near Irwin, ID Cableway
THE VELOCITY-AREA METHOD Cross section area Discharge = (Area of water in cross section) x (Water velocity) x Water Velocity
The channel cross section is divided into numerous sub-sections Discharge of each sub-section = Area x Average Water Velocity
The stream discharge is the sum of the discharges inall the sub-sections. 1 2 3 Total Discharge = ((Area1 x Velocity 1) + (Area2 x Velocity2) + ….. (Arean x Velocityn)) n
Making the Measurement • Verticals should be spaced so that no sub-section has more than 10% of the total discharge. • An ideal measurement has no more than 5% of the total discharge in any sub-section. • Measurements should contain between 25 and 30 sub-sections. • The spacing between the verticals should be closer in those parts of the cross section with greater depths and velocities.
Measuring Water Depth • Determine the depth to the nearest 0.02 ft (0.05 ft for turbulent flows). • Visually extend the water surface to the wading rod mark.
Measure velocity for at least 40 seconds • The velocity should be measured for at least 40 seconds • 40 seconds evens out short-term velocity fluctuations • 20 seconds is acceptable during periods of rapidly changing stage
Velocity Determination • The USGS generally uses the Price current meter or the FlowTracker • Use the AA meter for large depths and high velocities • Use the Pygmy meter for shallow depths and small velocities Standard AA Meter See OSW memos 85.07 and85.14 Pygmy Meter
Average Velocity • The goal is to represent the average velocity in the vertical. • Measured at 0.6 the depth when depths are shallow. • Measured at 0.2 and 0.8 the depth when depths are large. These two velocities are averaged to represent the average velocity in the vertical. Typical velocity profile
Non-Standard Conditions • The use of 0.6 and 0.2/0.8 methods assume the velocity profile is logarithmic. • Velocities should decrease closer to bottom due to friction. • If the velocity at 0.8 depth is greater than the velocity at 0.2 depth or if the velocity at 0.2 depth is twice the velocity at 0.8 depth then the velocity profile is considered abnormal and the three-point method must be used.
Three-Point Method • Three-point method is computed by averaging the velocity measured at 0.2 and 0.8 the depth and then averaging that result with the velocity measured at 0.6 the depth.
Determining a horizontal angle correction. Note Sheet Tagline or tape Read angle correction here Point of origin
Point of Zero Flow Include Velocity Head Gage Pool Control Section Flow Deepest Point on Control Gage Pool Control Section Perpendicular to Flow
Some Commonly Used ADCP’s RDI StreamPro RDI Rio Grande ADCP SonTek Mini-ADP SonTek M9
ADCP WITH TETHERED BOAT Pacific Creek at Moran, WY Shatt Abu-Lihia at Al-Islah Bridge, Iraq Snake River near Moran, WY Henrys Fork near Rexburg, ID
Recent memo points: • Need for moving bed test • Need for independent water temperature. • Recommended 12 minute exposure time.
FlowTracker, Aquacalc and DMX 1 Units are now available that compute velocity and/or discharge Aquacalc DMX FlowTracker 1Use of trade, product, or firm names is for descriptive purposes only and does not imply endorsement by the U.S. Government
Benefits of Hydroacoustic Current Meters Streamflow measurements are made in a timelier manner No moving parts Safer measuring conditions Measure a higher percentage of the velocities in the stream cross-section Ability to measure during rapidly varying flow conditions
Measuring Discharge Dwars Kill at Anderson Avenue at Alpine, NJ Flume Posts Brook above Wanaque diversion near Wanaque, NJ Volumetric Indirect San Pedro Creek near Golden, NM
Check Measurements • Should be made when measured discharge differs by > 5% from rating or shift trend (unless there is an obvious reason for this). • Ideally should be made using different equipment or at minimum a different cross section. • Very useful in defining and defending poorly defined segments of the rating.
Other QA considerations • Spin tests for mechanical meters • Diagnostic test for ADCPs • Beam checks for FlowTracker • Weighted mean GH during periods of rapidly changing stage.
Front Sheet • Summarizes: • Measurement results • 2. Gage operation • 3. Control conditions Well documented notes in field allows for better record computations
Discharge Measurement Data The data acquired during routine discharge measurements are the basis for all computations of streamflow records. • Snapshots in time documenting observations of real conditions—they display the true stage/discharge relation. • Data must be thoroughly checked and reviewed. • The checking process must also be documented on the note sheet. • Original data can not be erased!
Selected References • Mueller, D.S., and Wagner, C.R., 2009, Measuring Discharge with Acoustic Doppler Current Profilers from a Moving Boat: USGS Techniques and Methods Book 3, Chapter A22, 72 p. • Nolan, K.M. and Jacobson, N.D., Surface-water field techniques training class, USGS WRIR 98-4252, (http://wwwrcamnl.wr.usgs.gov/sws/fieldmethods) • Rantz, S.E., 1982, Measurement and Computation of Streamflow:Volumes I and II, USGS Water Supply Paper 2175, 631 p. • Turnipseed, D.P., and Sauer, V.B., 2010, Discharge Measurements at Gaging Stations: USGS Techniques and Methods Book 3, Chapter A8, 87 p. • V.B.Sauer and R.W. Meyer, Determination of Error in Individual Discharge Measurements”, USGS Open-file report 92-144