Download
1 / 17
170 likes | 329 Views
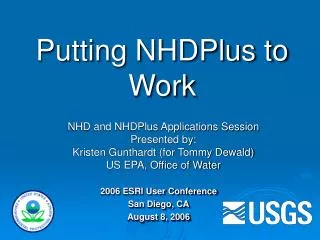
Putting NHDPlus to Work. NHD and NHDPlus Applications Session Presented by: Kristen Gunthardt (for Tommy Dewald) US EPA, Office of Water. 2006 ESRI User Conference San Diego, CA August 8, 2006. Presentation Overview. Enhancing the NHD Framework with NHDPlus

E N D
Putting NHDPlus to Work NHD and NHDPlus Applications Session Presented by: Kristen Gunthardt (for Tommy Dewald) US EPA, Office of Water 2006 ESRI User Conference San Diego, CA August 8, 2006
Presentation Overview • Enhancing the NHD Framework with NHDPlus • EPA Applying theNHD and NHDPlus • Applications – Just a Start
Enhancing the NHD Frameworkwith NHDPlus! • NHD • Hydrographic features for making maps • A national stream addressing system • A modeling network for navigating upstream/downstream • A maintenance infrastructure • NHDPlus • Improved network relationships and additional names • Value-added attributes • NHD reach catchments with attributes • Flow grids • Network node elevations • Flow volume and velocity (original goal!) • Stream gages linked to stream network
NHDPlus includes Topographically-Derived Catchments (2,613,709 total catchments)
National Hydrography Dataset WATERS Data Architecture (Watershed Assessment, Tracking & Environmental ResultS) (www.epa.gov/waters) WQSDB GRTS Water Quality Standards Nonpoint Source Grants Reach Address Database (RAD) STORET NTTS Water Quality Monitoring Impaired Waters & Total Maximum Daily Loads ADB/NAD Water Quality Assessments
Assessing Recovery Potential of Impaired Waters • Joint OW/ORD project • Recovery potential: the likelihood of an impaired water to reattain Water Quality Standards, given its ecological capacity to regain lost functions, its exposure to stressors, and its social context. • Opportunity to consider landscape factors related to recovery potential within drainage areas and stream corridors, using GIS
Endangered Species: An Example Potential Use of NHD in Pesticide Risk Assessments • The Office of Pesticide Programs is exploring the use of the NHD and value-added attributes in a variety of applications related to pesticide risk assessments. • In this example, NHD navigation tools are combined with the NLCD and NHD catchments (Thiessen-based) to estimate the direct and indirect effects of agricultural pesticide use on endangered aquatic species. Figure 2 Figure 1
USGS NAWQA SPARROW Modeling • Original USGS SPARROW (Spatially Referenced Regressions on Watershed Attributes) water quality models based upon Reach File Version 1 (RF1) 1:500,000-scale • Success of EPA-funded NHD-based New England SPARROW model (at right) has motivated plan to conduct similar modeling for several USGS NAWQA study areas during 05/06
SPARROW Model Results: Predicted Total Nitrogen Catchment Yield Contributions to Total Nitrogen from each source + = Atmospheric Developed + + Agriculture Point Source
Low Moderate High Very High Relative Debris-Flow Hazard In Response to 2”of Rainfall in 1 Hour Brins Fire, Arizona June 2006 FLAGSTAFF STUDY AREA SEDONA Relative Hazard PHOENIX ARIZONA
USGS StreamStats • StreamStats is a web application that greatly reduces the time needed to estimate streamflow statistics for ungaged sites and to make published streamflow statistics for USGS data-collection stations easily accessible • Based upon state-specific regression equations • Supports TMDLs
RWDB GEOGRAPHIC COVERAGE: 296 hydrologic units (4th-code HUCs) 23,342 surface water segs. 300 pulp & paper facilities (approx.) RWDB LOGISTICS: Linux Server: 0.5TB, 4-Disc RAIDw/off-site auto backup 784,528 data records/files >14,000 spatial data files RWDB INFORMATION TYPES: Watershed Characteristics Topography, HUCs, ecoregions, landuse/cover, soils, stream flow, weather, dams, gauges Water Quality Chemistry, bacteriological, sediment inventory, temperature, turbidity, chlorophyll Regulatory WQS, impairment listings and delistings, TMDL status, nutrient criteria Facility Data Mill (and other) discharge, PCS, TRI, RCRA, Superfund info. NCASI Receiving Water Database National Council for Air and Stream Improvement, Inc.
For More Information • Visit www.epa.gov/waters • Tommy Dewald, dewald.tommy@epa.gov • Kristen Gunthardt, gunthardt.kristen@epa.gov Questions?