Download
1 / 27
270 likes | 370 Views
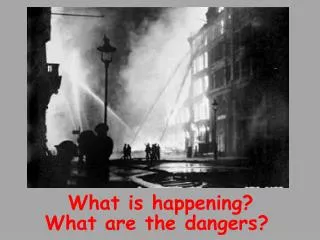
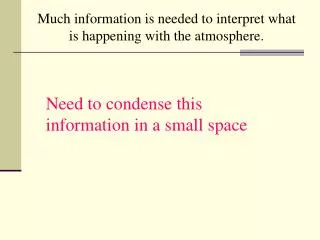
Much information is needed to interpret what is happening with the atmosphere. Need to condense this information in a small space. Station Model Allows the data to be plotted in a condensed and usable format. Location of the station on the map.

E N D
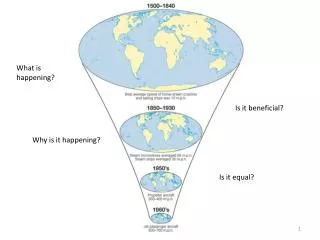
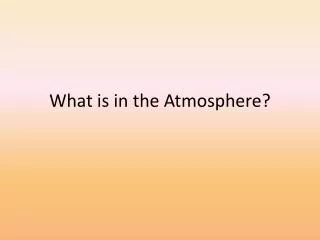
Much information is needed to interpret what is happening with the atmosphere. Need to condense this information in a small space
Station Model Allows the data to be plotted in a condensed and usable format
Location of the station on the map. The name of the location or airport abbreviation might be given nearby.
Temp Temperature information in degrees Fahrenheit.
Temp dew point Dew Point Temperature in degrees Fahrenheit.
Temp dewpt Wind direction A staff is rotated around the station. Remember, winds are identified as the direction FROM which they come. This would be a west northwest wind or about 290º.
Temp dewpt Wind Speed Attached to the staff are symbols for speed.
note, it is not on the end of the wind direction staff The coding for the wind speed symbols can be generalized as: half staff about 5 knots full staff about 10 knots these are additive for the total amounts three full staffs=30 knots
pressure Temp dewpt Current Barometric Pressure
Barometric Pressure is VERY important! average barometric pressure at sea level is 1013.25 mb. current barometric pressure is reported to the nearest TENTH BUT, they don’t want to waste space
average barometric pressure at sea level is 1013.25 mb. barometric pressure varies around this value + about 30 = 1043 somewhat higher 1013.3 somewhat lower - about 30 = 983
133 x average barometric pressure at sea level is 1013.25 mb. barometric pressure varies around this value they do not PRINT the beginning number or numbers 1013.3 ---- 13.3 they, also, do not PRINT the decimal point, but report to the nearest TENTH
From the three numbers, you must INTERPRET whether the preceding value is 10 or 9 Which would make the value most realistic?
add the decimal point and then consider which, a 10 or a 9 places the value NEAREST to the average pressure of 1013.25 mb.
(1013.3) What is the pressure? 084 08.4 1008.4 962 96.2 996.2 28.1 1028.1 281 987.5 875 87.5 322 32.2 1032.2
Not only is the pressure itself important, but so is the way the pressure has been changing. So, more information may be given and must be coded.
pressure Temp trend dewpt How has the barometer been changing? + it is higher now than in the past - it is lower now than in the past
pressure Temp change trend dewpt How much the pressure has changed the amount of change in the past three hours again, reported in TENTHS without the decimal
pressure Temp change shown trend Dew point What has the pressure been doing? Shown diagrammatically
pressure Temp change shown trend dewpt Total amount of cloud graphic depiction of percentage of the sky covered by clouds
about 75% no clouds about 25% completely overcast about 50%
pressure Temp change shown trend dewpt What is the present weather? The current weather is very important. A detailed set of symbols provides weather descriptions.
Samples of present weather symbols. rain fog * snow haze slight rain showers , thunderstorm drizzle . ice or snow pellets lightning cloud development not observed
pressure Temp change shown visibility trend dewpt The visibility is especially important for pilots. Visibility is given in miles and fractions
pressure Temp change shown visibility trend dewpt PAST The past weather uses symbols. , *
pressure Temp change shown visibility trend dewpt PAST ppt The amount of precipitation amount Amount of precipitation is plotted in inches to the nearest hundredth of an inch.