Download

1 / 12
120 likes | 267 Views
Height of a Zero Gravity Parabolic Flight. Math 1010 Intermediate Algebra Group Project Lillian Fritzel. Have you ever wondered what it might feel like to float is space? In this presentation I will demonstrate how to find a quadratic formula from data and how to be able to

E N D
Height of a Zero Gravity Parabolic Flight Math 1010 Intermediate Algebra Group ProjectLillian Fritzel
Have you ever wondered what it might feel like to float is space? In this presentation I will demonstrate how to find a quadratic formula from data and how to be able to Understand how long you may have to feel the sensation that you are weight less!
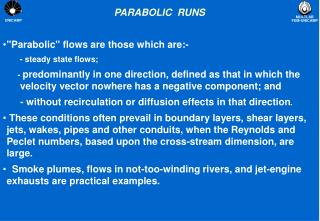
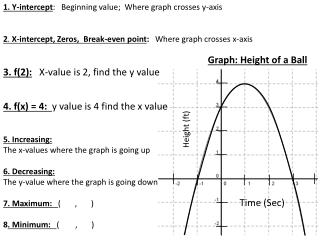
STEP#1Understanding the Data In this lab we took a look at a parabolic path and determined the maximum altitude the plane reaches during the parabolic flight. To do this we first looked at our data given and indentified the x and y axis to then plug in our points to form three system equations to the model a quadratic model for the flight.
STEP#2 From the data we can now plug it into a formula We switched the equation around so that the variables are on the left side of the equality * Notice the location of (2), (20), (40) as well as 23645, 32015, and 33715*
We now have a 3 by 3 system to solve (Step#2 continued) The next step is to first eliminate the c variables from the equations I multiply (-1) by line (1) and add line (2) in order to cancel c to create line (4) Then I multiply (-1) by line (2) and add line (3) to cancel c to create line (5)
Cancel c solve for b(step#2 cont.) Combine line 4 With line 5 ) We then canceled a to solve for b. To do this you can multiply each equation by it’s a variable and add together. (a) will then cancel and you are left with two equations equal to b. From here you would set both equations to b and divide to find that b=685
Substitute b to Solve for a then substitute a to solve for c (step#2)
STEP#3 Write the quadratic function From this point we plugged a, b, c Into the quadratic formula to the right- to get x intercepts for plotting the graph latter on Our quadratic model/function is the following quadratic equation. Since there is a (-) in front of the mx+b [10] then it contains a maximum or the graph may look like an arched bridge
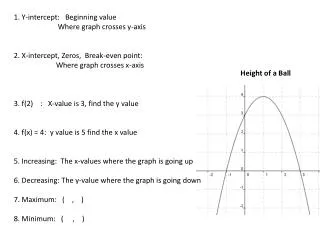
Step#4 Find the Maximum value of the quadratic model • To find the Maximum we must use a formula that finds a vertex of a quadratic function. • We plug 34.25 into quadratic function • This also gives us the axis of symmetry
STEP#5 Graph to show the parabolic flight (34.25,34045.625) is the axis of symmetry as well as the Maximum *special thanks to http://www.webgraphing.com/graphing_basic.jsp
Review *Find data point to create 3 by 3 system *Solve the system *Write a quadratic function *Find Maximum of function *Graph the parabolic flight
Thank you for looking at my presentation!Created by:Lillian Fritzel Math 1010