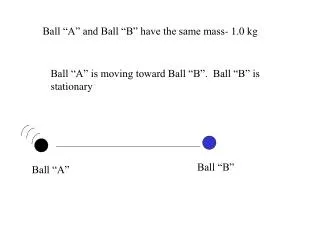
Mathematical Functions and Graphs for Easy Understanding
120 likes | 254 Views
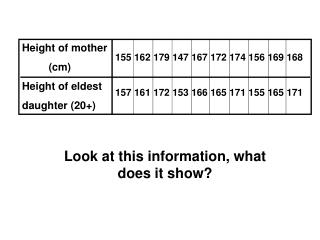
Learn about y and x intercepts, break-even points, increasing/decreasing functions, maximum and minimum points, and solve equations with helpful examples.

Mathematical Functions and Graphs for Easy Understanding
E N D
Presentation Transcript
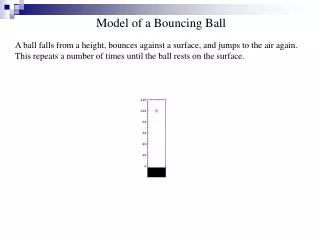
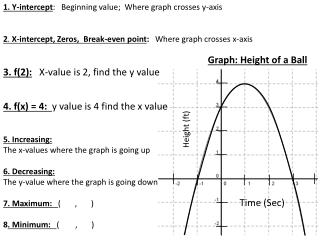
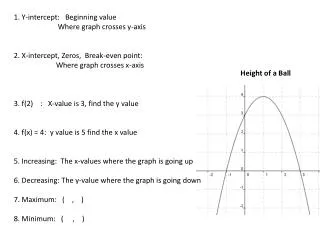
1. Y-intercept: Beginning value Where graph crosses y-axis 2. X-intercept, Zeros, Break-even point: Where graph crosses x-axis 3. f(2) : X-value is 3, find the y value 4. f(x) = 4: y value is 5 find the x value 5. Increasing: The x-values where the graph is going up 6. Decreasing: The y-value where the graph is going down 7. Maximum: ( , ) 8. Minimum: ( , ) Height of a Ball
1. Y-intercept 2. Find Break-even point: 3. X-intercept 4. Find and interpret f(5) : 5. Find and interpret f(x) = 8: 6.Increasing: 7.Solve by the graph: 2x – 4 = 10 Profit from Sally’s Lemonade Stand Profit ($) Number of Glasses Sold
1. Initial Value: 2.Break-even point: 3. Find and interpret f(2) : 4. Find and interpret f(x) = 40: 5. Increasing: 6. Find and interpret the maximum: 7. When is -4x2 – 40x – 50 = 20? Projected Profit of Concert Based on Ticket Price Profit (Hundred’s of Dollars) Cost of Ticket ($)
Number of Starbucks Outlets Find and interpret f(2000) 2. Find and interpret the y-intercept 3. Find and interpret f(x) = 10000
1. After how many miles will the companies be the same? 2. Explain when each company is a better value. 3.Find and interpret the y-intercept of A(x) and what does it mean? 4. Find and Interpret B(2) 5. When is 3x + 1 = 4? 6. When is 3x + 1 = x + 5 Cost of Cab Rides Company A A(x) = x + 5 Fare ($) Company B B(x) = 3x + 1 Miles
What time will they have climbed the same amount of stories? 2. How many stories will they have climbed? 3. Find and interpret the y-intercept of person A? 4. When x+2 = 4? Stair Stories Climbed by Two Climbers A(x) =(1/2)x + 5 Stories B(x) =x + 2 Time (minutes)
1. Find and Intrepret Y-intercept 2. Find Break-even point: 3. X-intercept 4. Find and interpret f(5) : 5.Find and interpret f(x) = 6: 6.Solve by the table: 2x – 2 = 4 7. Write the NEXT-NOW equation Profit of Selling Popcorn Bags Profit x y 0 -2 1 0 2 2 3 4 4 6 5 8 Y1=2x - 2
1. Find and interpret y-intercept 2.Find and interpret Break-even point: 3.Find and interpret zeros 4.Find and interpret f(4) : 5.Find and interpret f(x) = -4: 6.Solve by the graph: 3x – 7 = 2 Profit of Selling Pompoms # of Pompoms Profit x y -1 -10 0 -7 1 -4 2 -1 3 2 4 5 Y = 3x - 7
1. After how many miles will the companies be the same? 2.Explain when each company is a better value. 3.Find and interpret the y-intercept of A(x) and what does it mean? 4. Find and Interpret B(2) 5. When is 2x + 3 = 2.5x + 1 6. When is 2x + 3 = 13? 7. Write the NEXT-NOW equation for B(x) Delivery Charges of 2 Companies A(x) B(x) x 'L1 "L2 0 3 1 1 5 3.5 2 7 6 3 9 8.5 4 11 11 5 13 13.5 6 15 16 A(x) = 2x + 3 B(x) = 2.5x + 1
YearMillions of Cars in US 1950 6 1955 7.81960 7.3 1965 10.3 1970 10.1 1975 10.8 1980 11.5 1985 15.4 1990 13.5 1995 15.5 2000 17.4 2005 16.9 1. Find and interpret f(1955) 2. Find and interpret f(x) = 17.4 3. When were there 11.5 million cars In the US?