Download
1 / 29
290 likes | 436 Views
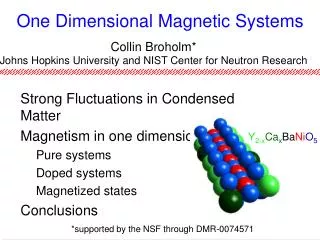
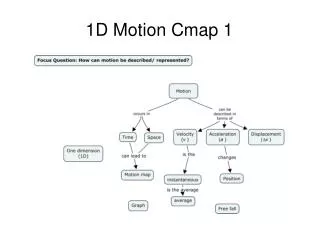
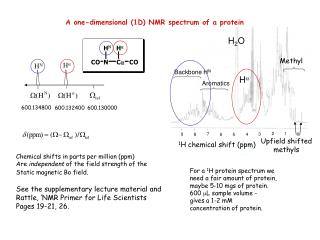
A one-dimensional (1D) NMR spectrum of a protein. H 2 O. Methyl. H . H N. Backbone H N. H . Aromatics. 600.134800. 600.132400. 600.130000. 2. 1. 9. 3. 0. 7. 8. 4. 6. 5. Upfield shifted methyls. 1 H chemical shift (ppm). Chemical shifts in parts per million (ppm)

E N D
A one-dimensional (1D) NMR spectrum of a protein H2O Methyl H HN Backbone HN H Aromatics 600.134800 600.132400 600.130000 2 1 9 3 0 7 8 4 6 5 Upfield shifted methyls 1H chemical shift (ppm) Chemical shifts in parts per million (ppm) Are independent of the field strength of the Static magnetic Bo field. See the supplementary lecture material and Rattle, ‘NMR Primer for Life Scientists Pages 19-21, 26. For a 1H protein spectrum we need a fair amount of protein, maybe 5-10 mgs of protein. 600 L sample volume - gives a 1-2 mM concentration of protein.
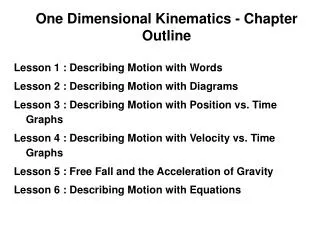
The 1D 1H spectrum of a protein H2O CgH CdH CbH Aromatics CaH Amides Upfield shifted methyl 9 8 7 6 5 4 3 2 1 0 ppm
6.8-7.2 ppm 8.0-8.8 ppm A lot of work done with histidine since the C2 proton appears at higher frequency than most other protons.
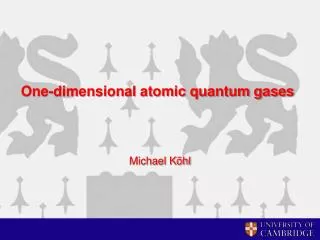
1H NMR spectrum of Histidine - C2 proton appears at higher frequency than most other protons and is sensitive to the protonation of the ring. C2H C4H CbH CaH 6.8-7.2 ppm 0 10 Raise pH 8.0-8.8 ppm Shown in protonated form ppm 0 10
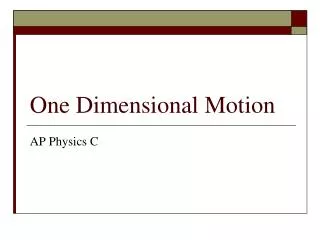
Titration of the C2H of Histidine Shift measured with multiple 1D spectra starting with pH 1.0 and moving through to pH 9 The chemical shift change of the proton on C2 reflects the protonation of N1 1 50% of complete change Chemical Shift Change Dd (ppm) pKa = 5.2 0 1 3 5 7 9 11 pH
4 histidines which could be monitored and have their pKa’s measured.
H1 = His105 H2 = His119 H3 = His12 H4 = His48 Measure pKa of each histidine pKa His105 6.7 His119 6.2 His12 5.8 His48 is more complex, sudden discontinuity in the curve.
There is a conformational change affecting this peak so that at some pHs two peaks were observed. H4a and H4b were acid and base stable forms. Found that 200mM Na+CH3COO- helped to stabilize the protein. Can then determine that the pKa of C2H is 6.31.
Repeat titrations in the presence of an inhibitor. in this case, cytidine-3’- monophosphate (3’-CMP) His105 His12 His119 His48 and His105 are unchanged His12 and His119 curved are shifted downfield. His48 His119 changes from 6.2 to 8.0 His 12 changes from 5.8 to 7.4 Why downfield?? Both His12 and His119 are protonated in the enzyme-inhibitor complex. The proton is protected from exchange by the presence of the inhibitor. Need to go to higher pH to remove it.
A simple 1D NMR Spectrum - this is ethanol but the spectrum has the sort of simplicity we might get with a one amino acid protein (there is no such thing!) A successful NMR experiment comes in 3 stages, 1.) Resolve the resonances - that is, obtain a spectrum where individual signals are clearly resolved from one another. 2.) Assign the resonances. Each peak comes from one atom in the protein - but which one? Our 36 amino acid protein is a mess! The record to date is 723 amino acids With full assignment of the spectrum - how did they do this? 3.) Interpret the data. A 36 amino acid protein
Effect of increasing spectrometer frequency 1 GHz soon??
s-1 (Hz) Larmor Frequency rad s-1 T-1. rad s-1 T
A nuclear spin precesses in a magnetic field the circulating motion of the spin angular momentum is called precession this arrow denotes the direction of the spin angular momentum • Nuclear spins precess because: • they are magnetic • they have angular momentum
Precession frequency = Larmor frequency Larmor frequency in Hz (= cycles per second) n0 = - g Bo/2π magnetic field in Tesla (T) gyromagnetic ratio in rad s–1 T–1 Compare with Zeeman Splitting
Magnetic vectors precess around the static magnetic field at the larmor frequency. There is a slight population excess in the low energy () state. This leads to a net magnetization along Z (in green). There is no net magnetisation along x or y as this is essentially randomised. z Bo y y y x x x
Generation of transverse magnetization by π/2 pulse z z (p/2)x y y p/2 x x Magnetization perpendicular to the magnetic field is called transverse magnetization Net Moment y
NMR signal Bo z y The NMR signal is also called the free induction decay (fid) x Note the orientation of the coil -perpendicular to the magnetic field Preamp
Precession of Transverse Magnetization Bo z z z xy plane y y y x x x oscillation at the Larmor frequency Mx (t) = Mzeq sin(t) exp{-t / T2} Mx Time decay time constant =spin-spin relaxation time OR transverse relaxation time My (t) = -Mzeq cos(t) exp{-t / T2} Time My The transverse magnetization components oscillate and decay
Diagonal Crosspeaks Diagonal
Typical Amino Acid spin-system patterns on COSY spectra 1.) Just see 3J coupling 2.) Do not see couplings across the peptide bond.