Download
1 / 17
170 likes | 289 Views
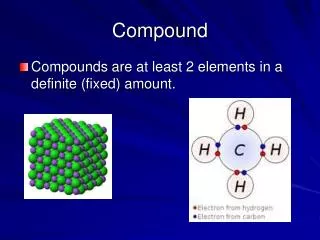
Compound. Inequalities. You already know inequalities. Often they are used to place limits on variables. That just means x can be any number equal to 9 or less than 9. Sometimes we put more than one limit on the variable:.

E N D
Compound Inequalities
You already know inequalities. Often they are used to place limits on variables. That just means x can be any number equal to 9 or less than 9.
Sometimes we put more than one limit on the variable: Now x isstill less than or equal to 9, but it must also be greater than or equal to –7.
-25 -20 -15 -10 -5 0 5 10 15 20 25 Let’s look at the graph: The upper limit is 9. Because xcan be equal to 9, we mark it with a filled-in circle.
We need to choose a number from that region. -25 -20 -15 -10 -5 0 5 10 15 20 25 You want to choose 0? Good choice! 0 is usually the easiest number to work with.
Let’s graph another inequality: -25 -20 -15 -10 -5 0 5 10 15 20 25
-25 -20 -15 -10 -5 0 5 10 15 20 25 A quick review: To graph a compound inequality: 1. Find and mark the boundary points. 2. Test points from each region. 3. Shade the regions that satisfy the inequality. ? ? ?
-25 -20 -15 -10 -5 0 5 10 15 20 25 A quick review: 1. Find and mark the boundary points. 2. Test points from each region. 3. Shade the regions that satisfy the inequality. or
-25 -20 -15 -10 -5 0 5 10 15 20 25 Given the graph below, write the inequality. First, write the boundary points.
-25 -20 -15 -10 -5 0 5 10 15 20 25 Then look at the marks on the graph, and write the correct symbol.
-25 -20 -15 -10 -5 0 5 10 15 20 25 Since x is between the boundary points on the graph, it will be between the boundary points in the inequality.
-25 -20 -15 -10 -5 0 5 10 15 20 25 Since x is between the boundary points on the graph, it will be between the boundary points in the inequality.
-25 -20 -15 -10 -5 0 5 10 15 20 25 Try this one: Again, begin by writing the boundary points:
Write the inequality from the graph: -25 -20 -15 -10 -5 0 5 10 15 20 25 1: Write boundaries: 2: Write signs: 3: Write variable:
Is this what you did? Solve the inequality:
You did remember to reverse the signs . . . . . . didn’t you? Good job!