Assessment of Satellite and Gauge Rainfall for Hydrologic Predictions in South America
This study analyzes TRMM and gauge rainfall data in the La Plata River Basin to enhance flood and drought monitoring, hydroelectric power generation, and water resources management. Satellite precipitation estimates are crucial for flood prediction and are compared with gauge measurements to assess discrepancies and improve hydrological flux simulations.

Assessment of Satellite and Gauge Rainfall for Hydrologic Predictions in South America
E N D
Presentation Transcript
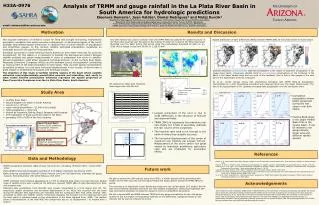
over under January 23rd, 2003 - 02:00 UTC Fields processed with CRA Area ~ 510,000 km2 Accumulated precipitation (mm) TRMM Prec. @ 12 UTC Gauge Prec. @ 12 UTC Predicted rainfall (shifted) 5 % 1.1 % 2.6 % 1.1 % Gauge rainfall Source: Climate Change in the La Plata Basin, Barros, et al. Upper Paraná Basin Summer (DJF) maximum precipitation linked to monsoon activity 5 % 7.7 % 9.3 % 6.3 % Northwards displacement Iguazu Basin maximum precipitation Fall (SON) and Spring (MAM) H33A-0976 email: edemaria@hwr.arizona.edu Results and Discussion Motivation Analysis of TRMM and gauge rainfall in the La Plata River Basin in South America for hydrologic predictionsEleonora Demaria1, Juan Valdés2, Daniel Rodriguez3 and Matej Durcik41Department of Hydrology and Water Resources, University of Arizona, 1133 E James E. Rogers Way, Tucson, AZ 85721, United States 2Department of Civil Engineering and Engineering Mechanics, University of Arizona, Tucson, AZ 85721, United States 3Centro de Previsàõ de Tempo e Estudos Climàticos, Rodovia Presidente Dutra, Km 40, Cachoeira Paulista, SP 12630, Brazil 4SAHRA-University of Arizona, Marshall Bldg. 845 N. Park Ave., Room 545. P.O.Box 210158-B, Tucson, AZ 85721, United States The accurate estimation of rainfall is crucial for flood and drought monitoring, hydroelectric generation, navigation and water resources management. In developing regions of the world, available hydrometeorological information is obtained from a coarse network of precipitation and streamflow gauges. In this context, satellite estimated precipitation constitutes an invaluable source to be used for flood prediction. Emergent economies in South America heavily depend on their water resources for economic development. For this reason, it is necessary to quantify the discrepancies existent between satellite products and gauge measurements in order to understand how errors in satellite-derived precipitation could affect simulated hydrological fluxes. In the La Plata River Basin, Mesoscale Convective Complexes (MCCs) are the dominant source of precipitation contributing as much as 80% of the total precipitation in some areas. Their accurate spatial representation by satellite products is crucial since horizontal displacements in the location of storms have a great impact on streamflows forecasted with hydrologic models. The objective of this study is twofold: identify regions of the basin where satellite estimates over/underestimate precipitation amounts and intensities; and, verify to what extent satellite precipitation estimates reproduce the spatial properties of Meso Convective Complexes over the La Plata River Basin, South America. The CRA method was used to evaluate how well TRMM 3B42.v6 captures the spatial structure of ten MCCs that occurred over the basin in the summer of 2002-03. A total of 140 MCCs have been identified over the basin during that period using the methodology described by Salio et. al., 2006. MCCs ranged in size from 50,000 to 1,138,00 km2. Spatial distribution of daily differences (BIAS) between TRMM 3B42.v6 and observations for each season Satellite estimates underestimate observed precipitation in the region of maximum precipitation the Iguazu River Basin. Conversely satellite tends to overestimate observations on the northeast of the basin the Upper Paraná basin and over part of the southeast. Due to lack of rain gauges in the west part of the basin biases were not computed. Su et al., (under review) shows that streamflows simulated with TRMM 3B42.v6 precipitation overestimate by a 22% streamflows simulated with observed fields over the Upper Paraná basin. The bias in the Iguazu Basin is 9%. Spatially averaged daily precipitation over the two basins show: We selected ten MCCs with maximum areas larger than 350,000 km2 Study Area • Cumulative precipitation shows better agreement during the wet season over both basins • Positive BIAS larger in the Upper Paraná Basin than in the Iguazu Basin. It can be related to rain gauge density, larger area and different rainfall genesis • La Plata River Basin • second largest river basin in South America • covers 3.2 x 10⁶ km2 • mean annual streamflow ~ 21,000 m3/s (outlet) • total precipitation ~ 2000 mm • shared by Argentina, Bolivia, Brazil, Paraguay and Uruguay • 50% population of those countries reside in the basin • generates 70% of GPD of the five countries • Largest component of the error is due to small differences in the structure of forecast and observed fields. • TRMM 3B42.v6 represents the maximum rain rate closely but it fails to accurately estimate the rain volume of the complexes. • The heaviest rains tend to be forecast to the north of where they actually occurred. • The horizontal displacements of the center of maximum rain intensity can surpass 100 km. Misplacement of the storm center has great impact on hydrologic predictions, agriculture uses and are invaluable for evacuation efforts. References Data and Methodology Barros V., R. Clarke and P. Silva Dias. Climate Change in the La Plata Basin. Project SGP II 057- Inter American Institute on Global Change (IAI) Ebert E. E. and J.L. McBride, 2000. Verification of precipitation in weather systems: determination of systematic errors, J Hydro, 179-202. Huffman G.J. et al, 2007. The TRMM Multisatellite Precipitation Analysis (TMPA): Quasi-Global, Multiyear, Combined-Sensor Precipitation Estimates at Fine Scales. J Hydrometeorology, 8, Issue 1, 38-55. Liebmann B and D. Allured, 2005. Daily Precipitation Grids for South America. BAMS, 1567-1670. Salio P. et al, 2006. Mesoscale Convective Systems over Southeastern South America and their relationship with the South American Low-Level jet. M. Weather Review, 135, 1290-1309. Su F. et al., (2007 submitted to J. Hydrometeorology). Evaluation of TRMM Multi-satellite Precipitation Analysis (TMPA) and its utility in hydrologic prediction in La Plata Basin. • TRMM precipitation estimates (3B42v.6 post-real time) @ 0.25 degree (Huffman 2007) - Period 1998-2006 • Daily gridded observed precipitation available @ 0.25 degree (Liebmann and Allured, 2005) • Daily observed precipitation SALLJEX (South America Low Level Jet Experiment) extended rain gauge network. Period November 15th 2002-February 15th 2003. Future work We plan to extend the CRA analysis using more MCCs. A similar analysis will be performed with smaller storms that occurred over the Upper Parana and Iguazu basins during the TRMM 3B42.v6 period. The next step is to implement a semi-distributed model over the La Plata Basin (VIC model). We will bias-correct satellite estimates and drive VIC with satellite precipitation, observed precipitation and bias-corrected precipitation to asses the impact of errors on streamflow simulations. We will compute BIAS and RMSE between TRMM and rain gauge precipitation at each rain gauge location to see the impact of interpolation schemes on the differences. Categories based on rain intensity will be used to compute the errors. TRMM estimates were temporal aggregated at 12 UTC to obtained daily totals over each grid cell. Spatial maps of satellite errors were created as the difference between TRMM 3B42.v6 and observations for daily and seasonal data. Observed daily precipitation from SALLJEX were linearly interpolated to a 0.25 degree grid cell. The magnitude, spatial correlation and horizontal displacement of ten MCCs that occurred over the basin during the SALLJEX field experiment are evaluated with the Contiguous Rain Area (CRA) method. CRA, developed by Ebert and McBride (2000), horizontally displaces the forecast over the observed field until the best match is obtained based on the minimization of the Mean Squared Error (MSE). The method allows a decomposition of the total MSE into components due to: a) Displacement ; b) Volume and c) Pattern. Acknowledgements This project has been funded by NASA Grant # NNG04GA79G to the University of Arizona and partially by SAHRA. We would like to thank the Institute for Study of Planet Earth (ISPE) at the University of Arizona for covering some travel expenses. Particular thanks go to Dr. Paola Salio from the Universidad de Buenos Aires (Argentina) who provided us with the list of MCCs used in this paper. Many thanks to Hoori Ajami for her help with ARCGIS. Dr. Beth Ebert from the Bureau of Meteorology Research Centre (Australia) patiently answered all our questions about CRA. We greatly appreciate Julio Cañon-Barriga constant help with MATLAB and discussing the results.