PURPOSE
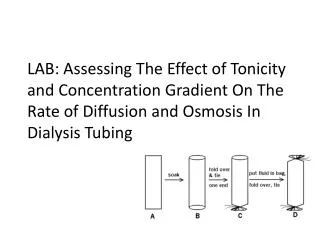
LAB: Assessing The Effect of Tonicity and Concentration Gradient On The Rate of Diffusion and Osmosis In Dialysis Tubing. PURPOSE. To assess the effect of different tonicities on the rate of passive transport in hypothetical cells.

PURPOSE
E N D
Presentation Transcript
LAB: Assessing The Effect of Tonicity and Concentration Gradient On The Rate of Diffusion and Osmosis In Dialysis Tubing
PURPOSE • To assess the effect of different tonicities on the rate of passive transport in hypothetical cells. • To observe the effects of different osmotic potentials on the integrity of these same hypothetical cells (i.e. cytolysis, turgor, plasmolysis) • Method: Immersion of dialysis tubing cells into baths of varying tonicity
PROTOCOL: Preparing The Systems • 1) Make sure that your lab station is covered with paper and that you are wearing an apron • 2) Fill three beakers with 150mL each of tap water. Label as systems #1-3 (hypotonic baths). • 3) The fourth beaker has already been filled with 150mL of 80% glucose. This is system #5 (hypertonic bath) • 4) System #4 data will be provided by your instructor.
PROTOCOL: Preparing the Cells • 4) Open five dialysis tubes using water and a glass rod. Tie off the bottom of each tube. • 5) Place 15mL of the following into the respective tubes and tie off the top leaving only a small air space. Cut off excess string and tubing. • System 1: 15mL tap water • System 2: 15mL 20% Glucose • System 3: 15mL 40% Glucose • *System 4: 15mL 80% Glucose (instructor only) • System 5: 15mL tap water
PROTOCOL: Weighing & Immersion • 6) Make sure that the scale is covered with a glass plate. Tare the plate, then weigh each of the “cells” (1-5) to ±0.1g. Record this initial mass in your lab notebook. • 7) WHEN YOUR INSTRUCTOR TELLS TO TO DO SO, immerse each of the cells into its respective system/bath. • 8) During the first 10 minute interval, meet at the front of the room to discuss yesterday’s simulation. • 9) After 10 minutes, remove each of the cells from the bath, wipe down the sides of the cell with a paper towel and reweigh to ±0.1g. Return immediately to the bath • 10) Repeat steps 8-9 at 10 minute intervals until 40 minutes have passed. • 11) Clean up but DO NOT THROW OUT THE HYPERTONC BATH (system #5)
ANALYSIS: Calculation of ∆m • To assess the effects of tonicity and osmotic potential on the cells, you will calculate the change in mass (∆m) for each 10 minute interval. • To calculate change in mass for any given interval, find the difference between the mass of the cell at that time and the INITIAL MASS. Note that ∆m may be positive or negative • Graph ∆m v. time for each of the five systems.
A conceptual problem… • Q = How do cells feed and excrete? • A = Via their cell membranes • So therefore, shouldn’t cells require MORE surface area?
Lab: Assessing the Rate of Cellular Transport v. Differing Surface Area to Volume Ratios • Purpose: To determine how the size of a cell is related to its ability to perform passive cellular transport • Method: ?
Materials: The following materials are available for your protocol
What You Need To Collect • Data: The following components will need to be part of the data presentation for your inquiry • A table showing the calculation of surface area to volume ratios for at least three different sizes of simulated cells (i.e. agar blocks) • A table showing the quantification of cellular transport (e.g. rate of change of conductivity, changes in mass, distance solutions penetrated into cell, etc.) for each of the different sizes of simulated cells. • A line graph (X-Y scatter plot) showing the quantification of passive transport (part B) v. surface area-volume ratio (part A) • Any relevant qualitative observations
Conclusion • Conclusion: After analyzing the results, write out a formal conclusion that addresses the following aspects of this investigation. • Restate, then confirm or refute your hypotheses regarding the relationship of surface-area-volume ratios v. rate of passive transport. • Describe the nature of the relationship between surface area-volume ratios and rate of passive transport. Is the relationship direct, inverse, optimal or inconsistent? If a relationship does exist, is it linear or exponential? • Select specific pieces (at least 3) of quantitative data from part B above to support your contentions regarding the nature of the relationship. • Based upon your information, how would cellular growth during the cell cycle affect the cell’s surface area to volume ratio? How, in turn, might that impact the ability of the cell to perform passive transport? • Why would a decline in the rate of passive transport be problematic for the cell in terms of homeostasis and energy flow? • As such, how might surface area-volume ratios serve as a trigger for cellular division? • Evaluate your protocol. What confounding variables or sources of error were present in this inquiry? How might that have specifically impacted your conclusions (part 2 above)?